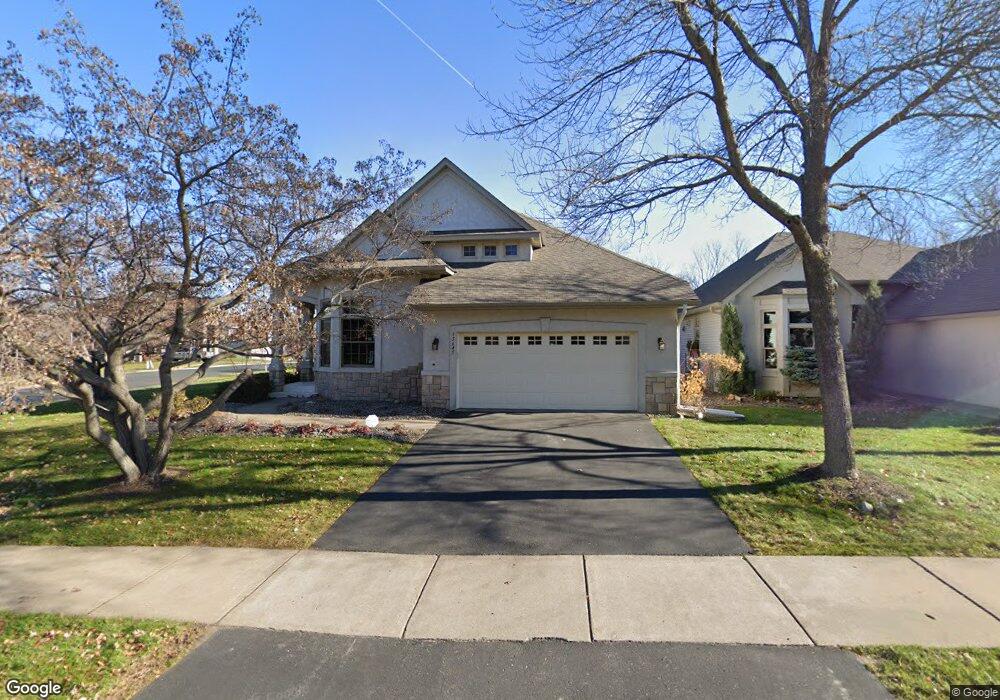
15645 73rd Cir N Maple Grove, MN 55311
Estimated Value: $613,256 - $717,000
3
Beds
3
Baths
1,880
Sq Ft
$356/Sq Ft
Est. Value
About This Home
This home is located at 15645 73rd Cir N, Maple Grove, MN 55311 and is currently estimated at $668,564, approximately $355 per square foot. 15645 73rd Cir N is a home located in Hennepin County with nearby schools including Basswood Elementary School, Maple Grove Middle School, and Maple Grove Senior High School.
Ownership History
Date
Name
Owned For
Owner Type
Purchase Details
Closed on
Oct 29, 2025
Sold by
Bartley Donothan R and Bartley Michelle H
Bought by
Donothan R Bartley Revocable Trust and Michelle H Bartley Revocable Trust
Current Estimated Value
Purchase Details
Closed on
Jun 24, 2009
Sold by
Couger Kelly and Couger Mary
Bought by
Bartley Donathan R and Bartley Michelle H
Purchase Details
Closed on
Jul 29, 2005
Sold by
Forehand Scott R and Forehand Elizabeth A
Bought by
Conger Kelly and Conger Mary
Purchase Details
Closed on
Feb 4, 1999
Sold by
Lundgren Bros Construction Inc
Bought by
Forehand Scott R and Forehand Elizabeth A
Purchase Details
Closed on
Jan 14, 1998
Sold by
B F Holding Company
Bought by
Lundgren Bros Construction Inc
Create a Home Valuation Report for This Property
The Home Valuation Report is an in-depth analysis detailing your home's value as well as a comparison with similar homes in the area
Home Values in the Area
Average Home Value in this Area
Purchase History
| Date | Buyer | Sale Price | Title Company |
|---|---|---|---|
| Donothan R Bartley Revocable Trust | -- | None Listed On Document | |
| Bartley Donathan R | $418,000 | -- | |
| Conger Kelly | $465,000 | -- | |
| Forehand Scott R | $288,103 | -- | |
| Lundgren Bros Construction Inc | $39,000 | -- |
Source: Public Records
Tax History Compared to Growth
Tax History
| Year | Tax Paid | Tax Assessment Tax Assessment Total Assessment is a certain percentage of the fair market value that is determined by local assessors to be the total taxable value of land and additions on the property. | Land | Improvement |
|---|---|---|---|---|
| 2024 | $7,177 | $575,100 | $120,400 | $454,700 |
| 2023 | $6,548 | $548,700 | $120,400 | $428,300 |
| 2022 | $5,633 | $520,900 | $74,900 | $446,000 |
| 2021 | $5,396 | $464,100 | $73,100 | $391,000 |
| 2020 | $5,609 | $437,200 | $71,000 | $366,200 |
| 2019 | $5,784 | $431,500 | $66,000 | $365,500 |
| 2018 | $5,630 | $420,000 | $60,000 | $360,000 |
| 2017 | $5,322 | $366,800 | $65,000 | $301,800 |
| 2016 | $5,229 | $356,200 | $62,000 | $294,200 |
| 2015 | $5,657 | $373,300 | $98,000 | $275,300 |
| 2014 | -- | $337,900 | $70,000 | $267,900 |
Source: Public Records
Map
Nearby Homes
- 15770 73rd Place N
- 7261 Quantico Ln N
- 7244 Quantico Ln N
- 7094 Weston Ln N
- 7082 Weston Ln N
- 7099 Weston Ln N
- 16236 70th Place N
- 7585 Lanewood Ln N
- 16314 70th Ave N
- 16322 70th Ave N Unit 204
- 7453 Mariner Dr
- 7720 Niagara Ln N
- 6848 Polaris Ln N
- 7870 Ranchview Ln N
- 15097 67th Place N
- 7788 Everest Ct N
- 7071 Empire Ln N
- 17225 72nd Ave N Unit 2001
- 16888 78th Ave N
- 17390 72nd Ave N Unit 1301
- 15653 73rd Cir N
- 15613 73rd Place N
- 15661 73rd Cir N
- 15581 73rd Place N
- 7355 Shenandoah Ln N
- 15669 73rd Cir N
- 15650 73rd Cir N
- 15600 73rd Place N
- 15658 73rd Cir N
- 15569 73rd Place N
- 15677 73rd Cir N
- 7377 Shenandoah Ln N
- 15676 73rd Cir N
- 15547 73rd Place N
- 15558 73rd Place N
- 15703 73rd Place N
- 15685 73rd Cir N
- 7389 Shenandoah Ln N
- 15525 73rd Place N
- 15694 73rd Cir N