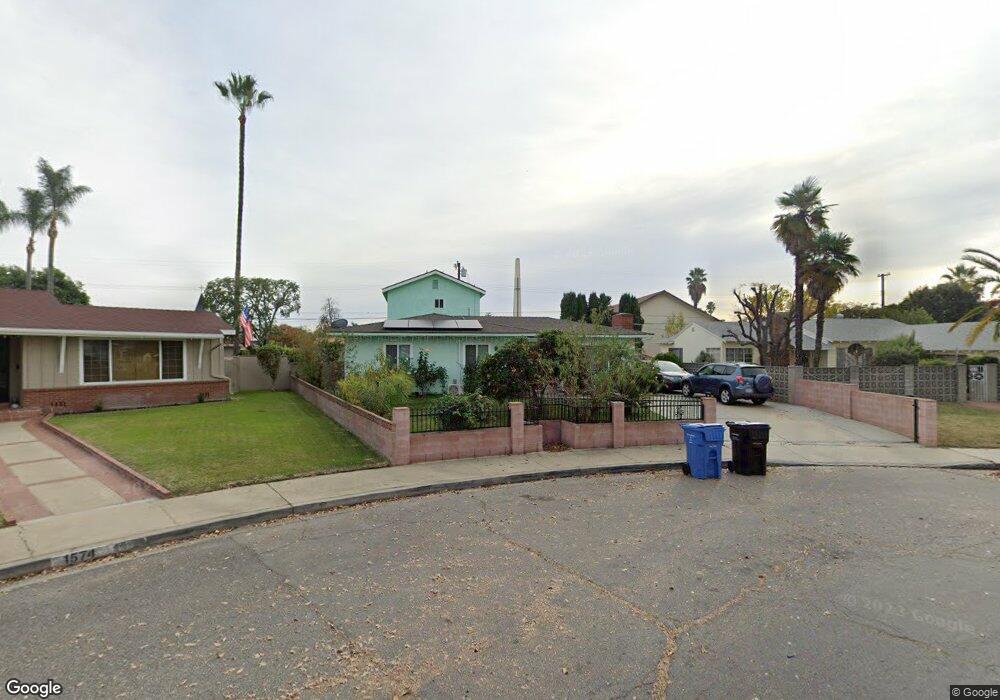
1566 Elysian Ave Pomona, CA 91767
Pomona East NeighborhoodEstimated Value: $701,000 - $827,230
3
Beds
2
Baths
1,254
Sq Ft
$620/Sq Ft
Est. Value
About This Home
This home is located at 1566 Elysian Ave, Pomona, CA 91767 and is currently estimated at $777,558, approximately $620 per square foot. 1566 Elysian Ave is a home located in Los Angeles County with nearby schools including Kingsley Elementary School, Emerson Middle School, and Pomona High School.
Ownership History
Date
Name
Owned For
Owner Type
Purchase Details
Closed on
Oct 2, 2006
Sold by
Tang Timeng
Bought by
Torres Jorge
Current Estimated Value
Home Financials for this Owner
Home Financials are based on the most recent Mortgage that was taken out on this home.
Original Mortgage
$325,200
Outstanding Balance
$191,792
Interest Rate
6.25%
Mortgage Type
Purchase Money Mortgage
Estimated Equity
$585,766
Purchase Details
Closed on
Aug 13, 2001
Sold by
Alvarado Erika Nancy
Bought by
Alvarado Julio C
Home Financials for this Owner
Home Financials are based on the most recent Mortgage that was taken out on this home.
Original Mortgage
$148,354
Interest Rate
7.19%
Mortgage Type
FHA
Purchase Details
Closed on
Jun 26, 2001
Sold by
Alvarado Julio and Narvaiz Marlo
Bought by
Tang Timeng
Home Financials for this Owner
Home Financials are based on the most recent Mortgage that was taken out on this home.
Original Mortgage
$148,354
Interest Rate
7.19%
Mortgage Type
FHA
Create a Home Valuation Report for This Property
The Home Valuation Report is an in-depth analysis detailing your home's value as well as a comparison with similar homes in the area
Home Values in the Area
Average Home Value in this Area
Purchase History
| Date | Buyer | Sale Price | Title Company |
|---|---|---|---|
| Torres Jorge | $406,500 | North American Title Co | |
| Alvarado Julio C | -- | Ticor Title | |
| Tang Timeng | $150,500 | Ticor Title |
Source: Public Records
Mortgage History
| Date | Status | Borrower | Loan Amount |
|---|---|---|---|
| Open | Torres Jorge | $325,200 | |
| Previous Owner | Tang Timeng | $148,354 | |
| Closed | Tang Timeng | $4,513 |
Source: Public Records
Tax History
| Year | Tax Paid | Tax Assessment Tax Assessment Total Assessment is a certain percentage of the fair market value that is determined by local assessors to be the total taxable value of land and additions on the property. | Land | Improvement |
|---|---|---|---|---|
| 2025 | $8,139 | $661,042 | $435,694 | $225,348 |
| 2024 | $8,139 | $648,081 | $427,151 | $220,930 |
| 2023 | $7,976 | $635,375 | $418,776 | $216,599 |
| 2022 | $7,853 | $622,917 | $410,565 | $212,352 |
| 2021 | $7,372 | $585,300 | $370,700 | $214,600 |
| 2019 | $7,049 | $522,036 | $333,000 | $189,036 |
| 2018 | $6,588 | $518,330 | $333,000 | $185,330 |
| 2016 | $4,416 | $351,500 | $281,200 | $70,300 |
| 2015 | $3,739 | $292,000 | $233,600 | $58,400 |
| 2014 | $3,784 | $292,000 | $233,600 | $58,400 |
Source: Public Records
Map
Nearby Homes
- 965 Capper Ave
- 1317 Caprino Way
- 1260 Lincoln Ave
- 1667 E Kingsley Ave
- 1305 E Kingsley Ave
- 1441 Sheridan Ave
- 1841 Fellows Place
- 1862 Bonnie Brae St
- 1830 Benedict Way
- 602 Karesh Ave
- 1837 Benedict Way
- 1960 Annandale Way Unit 104
- 1989 Annandale Way
- 1113 San Bernardino Ave
- 704 Mountain Ave
- 118 Bryn Mawr Rd
- 9621 Mills Ave
- 1324 -1340 E Kingsley Ave
- 4478 San Bernardino St
- 886 E Kingsley Ave
- 1558 Elysian Ave
- 1574 Elysian Ave
- 1278 Cordova St
- 1550 Elysian Ave
- 1303 Cordova St
- 1304 Cordova St
- 1536 Elysian Ave
- 1251 Indian Hill Blvd
- 1277 Indian Hill Blvd
- 1329 Cordova St
- 1328 Cordova St
- 1547 Elysian Ave
- 1305 Indian Hill Blvd
- 1469 Lincoln Ave
- 1520 Elysian Ave
- 1524 Lincoln Ave
- 1518 Lincoln Ave
- 1529 Elysian Ave
- 1530 Lincoln Ave
- 1504 Lincoln Ave
Your Personal Tour Guide
Ask me questions while you tour the home.