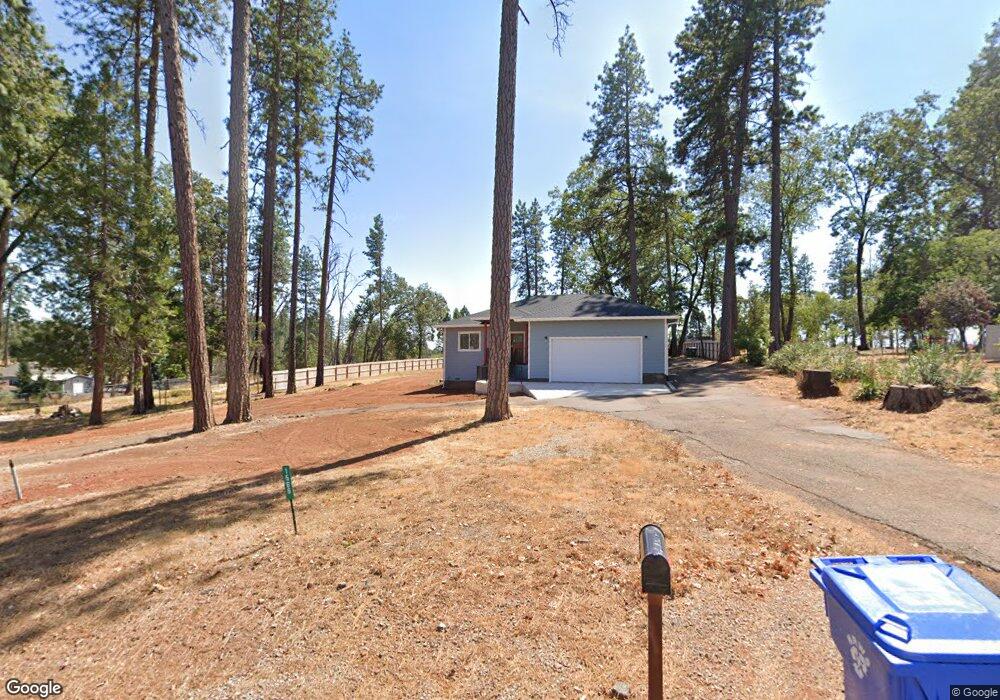
1566 Sylvan Way Paradise, CA 95969
Estimated Value: $376,000 - $522,000
3
Beds
3
Baths
1,527
Sq Ft
$283/Sq Ft
Est. Value
About This Home
This home is located at 1566 Sylvan Way, Paradise, CA 95969 and is currently estimated at $432,022, approximately $282 per square foot. 1566 Sylvan Way is a home located in Butte County with nearby schools including Ponderosa Elementary School, Paradise Junior High School, and Paradise Senior High School.
Ownership History
Date
Name
Owned For
Owner Type
Purchase Details
Closed on
Feb 23, 2008
Sold by
Hagy David D and Hagy Sonja M
Bought by
Hagy David D and Hagy Sonja M
Current Estimated Value
Home Financials for this Owner
Home Financials are based on the most recent Mortgage that was taken out on this home.
Original Mortgage
$367,500
Outstanding Balance
$199,721
Interest Rate
3.54%
Mortgage Type
Reverse Mortgage Home Equity Conversion Mortgage
Estimated Equity
$232,301
Purchase Details
Closed on
Aug 29, 2000
Sold by
Hagy Marguerite M
Bought by
Hagy David D and Hagy Sonja M
Purchase Details
Closed on
Jun 2, 1999
Sold by
Dimock Edmund T and Dimock Myrtle M
Bought by
Hagy David D and Hagy Sonja M
Home Financials for this Owner
Home Financials are based on the most recent Mortgage that was taken out on this home.
Original Mortgage
$38,700
Interest Rate
7.01%
Mortgage Type
Seller Take Back
Create a Home Valuation Report for This Property
The Home Valuation Report is an in-depth analysis detailing your home's value as well as a comparison with similar homes in the area
Home Values in the Area
Average Home Value in this Area
Purchase History
| Date | Buyer | Sale Price | Title Company |
|---|---|---|---|
| Hagy David D | -- | Lenders Choice Title Company | |
| Hagy David D | -- | -- | |
| Hagy David D | $114,000 | Fidelity National Title Co |
Source: Public Records
Mortgage History
| Date | Status | Borrower | Loan Amount |
|---|---|---|---|
| Open | Hagy David D | $367,500 | |
| Closed | Hagy David D | $38,700 |
Source: Public Records
Tax History Compared to Growth
Tax History
| Year | Tax Paid | Tax Assessment Tax Assessment Total Assessment is a certain percentage of the fair market value that is determined by local assessors to be the total taxable value of land and additions on the property. | Land | Improvement |
|---|---|---|---|---|
| 2025 | $2,010 | $338,366 | $58,366 | $280,000 |
| 2024 | $2,010 | $183,222 | $57,222 | $126,000 |
| 2023 | $658 | $56,100 | $56,100 | $0 |
| 2022 | $701 | $60,000 | $60,000 | $0 |
| 2021 | $428 | $35,000 | $35,000 | $0 |
| 2020 | $340 | $35,000 | $35,000 | $0 |
| 2019 | $392 | $40,000 | $40,000 | $0 |
| 2018 | $1,619 | $157,055 | $61,996 | $95,059 |
| 2017 | $1,593 | $153,977 | $60,781 | $93,196 |
| 2016 | $1,540 | $150,959 | $59,590 | $91,369 |
| 2015 | $1,514 | $148,692 | $58,695 | $89,997 |
| 2014 | $1,487 | $145,781 | $57,546 | $88,235 |
Source: Public Records
Map
Nearby Homes
- 5972 Peck Ln
- 5930 Sawmill Rd
- 1606 Sylvan Way
- 1608 Sylvan Way
- 1610 Sawpeck Way
- 1563 Sawpeck Way
- 1631 Sylvan Way
- 5970 Sylvan Ct
- 5945 Hazel Way
- 1604 Rowyn Cir
- 5991 Hazel Way
- 6040 Maxwood Dr
- 5936 Kibler Rd
- 1439 Powell Ln
- 5801 Thoreau Ln
- 1641 Which Way
- 1590 Young Ave
- 1419 Elliott Rd
- 1700 Bandtail Ln
- 1690 Connell Ln
- 1570 Sylvan Way
- 1565 Sylvan Way
- 1575 Sylvan Way
- 1546 Sylvan Way
- 1590 Sylvan Way
- 1555 Sylvan Way
- 5926 Sawmill Rd
- 5886 Sawmill Rd
- 1545 Sylvan Way
- 1601 Sylvan Way
- 5940 Sawmill Rd
- 0 Sylvan Way
- 5971 Peck Ln
- 1537 Sylvan Way
- 1603 Sylvan Way
- 5983 Peck Ln
- 5922 Sawmill Rd
- 5980 Sawmill Rd
- 5960 Sawmill Rd
- 5892 Cameron Ln