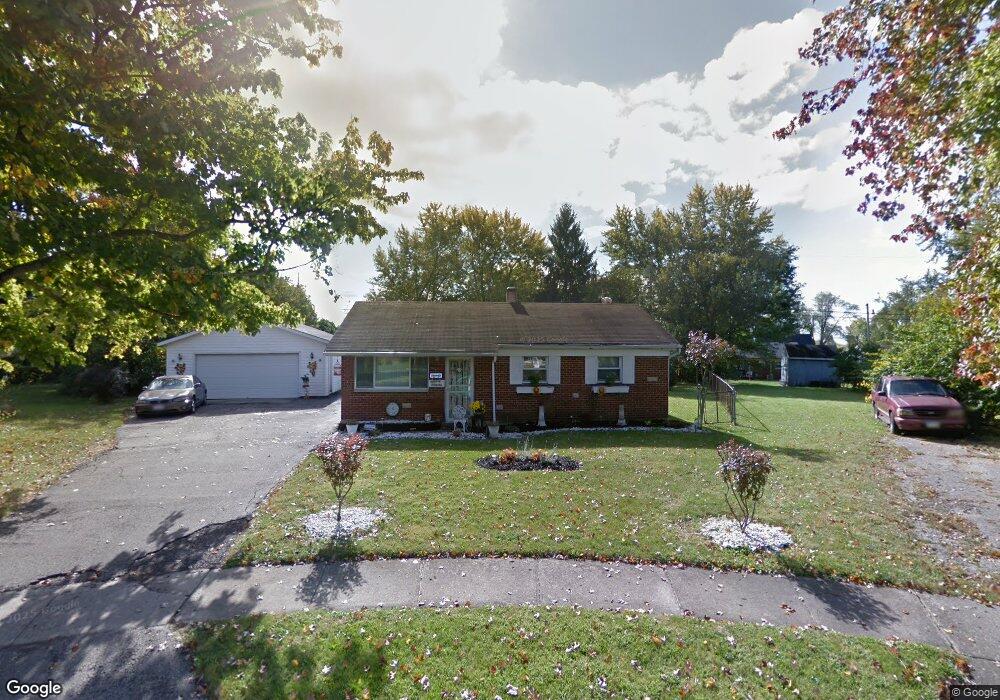
1566 Wyburn Place Dayton, OH 45417
Estimated Value: $133,000 - $147,791
3
Beds
1
Bath
1,325
Sq Ft
$106/Sq Ft
Est. Value
About This Home
This home is located at 1566 Wyburn Place, Dayton, OH 45417 and is currently estimated at $140,948, approximately $106 per square foot. 1566 Wyburn Place is a home located in Montgomery County with nearby schools including Blairwood Elementary School and Jefferson High School.
Ownership History
Date
Name
Owned For
Owner Type
Purchase Details
Closed on
Jul 15, 2022
Sold by
Julia Investments Llc
Bought by
Romans Sara Elizabeth
Current Estimated Value
Home Financials for this Owner
Home Financials are based on the most recent Mortgage that was taken out on this home.
Original Mortgage
$106,700
Outstanding Balance
$102,029
Interest Rate
5.7%
Mortgage Type
New Conventional
Estimated Equity
$38,919
Purchase Details
Closed on
May 6, 2020
Sold by
E Joseph E Lowe Md Inc
Bought by
Julia Investments Llc
Purchase Details
Closed on
Sep 21, 2016
Sold by
Real Estate Investors
Bought by
E Joseph Lowe Md Inc
Purchase Details
Closed on
Nov 13, 2006
Sold by
Orr Reggie L and Orr Sherry
Bought by
Real Estate Investors Place Llc
Home Financials for this Owner
Home Financials are based on the most recent Mortgage that was taken out on this home.
Original Mortgage
$29,890
Interest Rate
6.41%
Mortgage Type
Purchase Money Mortgage
Purchase Details
Closed on
Sep 16, 2002
Sold by
Orr Burl J and Orr Flossie M
Bought by
Orr Burl J and Orr Flossie M
Create a Home Valuation Report for This Property
The Home Valuation Report is an in-depth analysis detailing your home's value as well as a comparison with similar homes in the area
Home Values in the Area
Average Home Value in this Area
Purchase History
| Date | Buyer | Sale Price | Title Company |
|---|---|---|---|
| Romans Sara Elizabeth | $110,000 | Vantage Land Title | |
| Julia Investments Llc | $2,000 | None Available | |
| E Joseph Lowe Md Inc | -- | -- | |
| Real Estate Investors Place Llc | $25,700 | Attorney | |
| Orr Burl J | -- | -- |
Source: Public Records
Mortgage History
| Date | Status | Borrower | Loan Amount |
|---|---|---|---|
| Open | Romans Sara Elizabeth | $106,700 | |
| Previous Owner | Real Estate Investors Place Llc | $29,890 |
Source: Public Records
Tax History Compared to Growth
Tax History
| Year | Tax Paid | Tax Assessment Tax Assessment Total Assessment is a certain percentage of the fair market value that is determined by local assessors to be the total taxable value of land and additions on the property. | Land | Improvement |
|---|---|---|---|---|
| 2024 | $1,794 | $27,410 | $6,460 | $20,950 |
| 2023 | $1,794 | $27,410 | $6,460 | $20,950 |
| 2022 | $1,560 | $19,300 | $4,550 | $14,750 |
| 2021 | $1,563 | $19,300 | $4,550 | $14,750 |
| 2020 | $1,880 | $19,300 | $4,550 | $14,750 |
| 2019 | $1,912 | $19,230 | $3,470 | $15,760 |
| 2018 | $1,536 | $19,230 | $3,470 | $15,760 |
| 2017 | $1,526 | $19,230 | $3,470 | $15,760 |
| 2016 | $1,548 | $20,260 | $3,850 | $16,410 |
| 2015 | $1,577 | $20,260 | $3,850 | $16,410 |
| 2014 | $1,577 | $20,260 | $3,850 | $16,410 |
| 2012 | -- | $19,740 | $3,850 | $15,890 |
Source: Public Records
Map
Nearby Homes
- 5082 Derby Rd
- 5342 Tucson Dr
- 5212 Tucson Dr
- 4718 Belcourt Dr
- 4713 Vanguard Ave
- 1007 Rossiter Dr
- 4972 Dayton Liberty Rd
- 5396 Dushore Dr
- 4605 College View Dr
- 5357 Dushore Dr
- 1415 Olt Rd
- 3820 Germantown Pike
- 3916 Cone Ct
- 3942 Alvin Ave
- 2488 Olt Rd
- 2622 Soldiers Home-West Carrollton Rd
- 762 Ernroe Dr
- 6925 W Third St
- 71 Elkins Ave
- 72 Patton Ave
- 1558 Wyburn Place
- 1565 Wyburn Place
- 5035 Derby Rd
- 5025 Derby Rd
- 5045 Derby Rd
- 1583 Blairwood Ave
- 5017 Derby Rd
- 5055 Derby Rd
- 1567 Blairwood Ave
- 5090 Altrim Rd
- 1551 Wyburn Place
- 5080 Altrim Rd
- 5108 Altrim Rd
- 5068 Altrim Rd
- 5063 Derby Rd
- 5116 Altrim Rd
- 1557 Blairwood Ave
- 5071 Derby Rd
- 5124 Altrim Rd
- 5034 Derby Rd