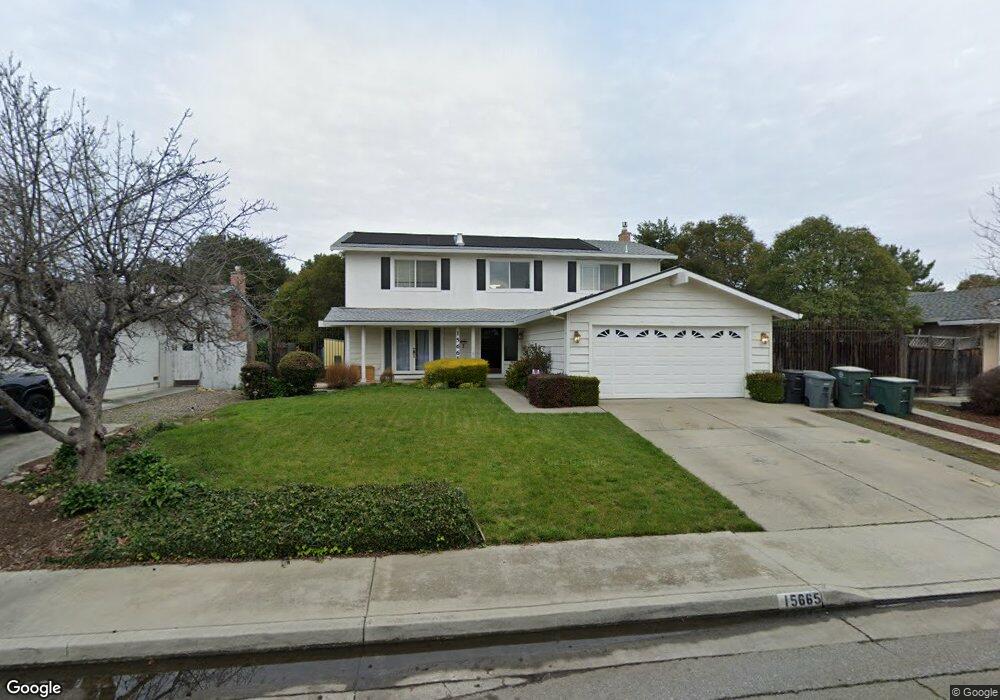
15665 La Bella Ct Morgan Hill, CA 95037
Estimated Value: $1,374,000 - $1,501,000
4
Beds
3
Baths
2,250
Sq Ft
$639/Sq Ft
Est. Value
About This Home
This home is located at 15665 La Bella Ct, Morgan Hill, CA 95037 and is currently estimated at $1,438,183, approximately $639 per square foot. 15665 La Bella Ct is a home located in Santa Clara County with nearby schools including Paradise Valley Elementary, Britton Middle School, and Ann Sobrato High School.
Ownership History
Date
Name
Owned For
Owner Type
Purchase Details
Closed on
Dec 7, 2023
Sold by
Beauchesne Rigo and Beauchesne Mimi
Bought by
Rigo Thomas and Arias Milagros
Current Estimated Value
Purchase Details
Closed on
Jul 7, 2009
Sold by
Freiberg Kenneth and Freiberg Susan
Bought by
Rigo Thomas and Rigo Mimi Beauchesne
Home Financials for this Owner
Home Financials are based on the most recent Mortgage that was taken out on this home.
Original Mortgage
$618,007
Interest Rate
4.87%
Mortgage Type
VA
Purchase Details
Closed on
Aug 14, 1996
Sold by
Shupe Michael C and Shupe Susan E
Bought by
Freiberg Kenneth and Freiberg Susan
Home Financials for this Owner
Home Financials are based on the most recent Mortgage that was taken out on this home.
Original Mortgage
$238,400
Interest Rate
8.42%
Create a Home Valuation Report for This Property
The Home Valuation Report is an in-depth analysis detailing your home's value as well as a comparison with similar homes in the area
Home Values in the Area
Average Home Value in this Area
Purchase History
| Date | Buyer | Sale Price | Title Company |
|---|---|---|---|
| Rigo Thomas | -- | None Listed On Document | |
| Rigo Thomas | $605,000 | Chicago Title Company | |
| Freiberg Kenneth | $298,000 | Old Republic Title Company |
Source: Public Records
Mortgage History
| Date | Status | Borrower | Loan Amount |
|---|---|---|---|
| Previous Owner | Rigo Thomas | $618,007 | |
| Previous Owner | Freiberg Kenneth | $238,400 |
Source: Public Records
Tax History Compared to Growth
Tax History
| Year | Tax Paid | Tax Assessment Tax Assessment Total Assessment is a certain percentage of the fair market value that is determined by local assessors to be the total taxable value of land and additions on the property. | Land | Improvement |
|---|---|---|---|---|
| 2025 | $11,649 | $780,932 | $225,886 | $555,046 |
| 2024 | $11,649 | $765,620 | $221,457 | $544,163 |
| 2023 | $8,639 | $750,609 | $217,115 | $533,494 |
| 2022 | $8,493 | $735,892 | $212,858 | $523,034 |
| 2021 | $8,279 | $721,464 | $208,685 | $512,779 |
| 2020 | $8,079 | $714,068 | $206,546 | $507,522 |
| 2019 | $8,306 | $700,068 | $202,497 | $497,571 |
| 2018 | $8,330 | $686,342 | $198,527 | $487,815 |
| 2017 | $8,250 | $672,885 | $194,635 | $478,250 |
| 2016 | $7,726 | $659,692 | $190,819 | $468,873 |
| 2015 | $7,642 | $649,784 | $187,953 | $461,831 |
| 2014 | $7,749 | $637,057 | $184,272 | $452,785 |
Source: Public Records
Map
Nearby Homes
- 605 Encino Dr
- 140 La Crosse Dr
- 133 La Crosse Dr
- 542 Via Sorrento
- 15180 Venetian Way
- 15120 Venetian Way
- 15145 Bellini Way
- 136 Vinewood Ln Unit 136
- 199 Leisure Dr Unit 199
- 97 Melody Ln Unit 97
- 92 Melody Ln Unit 92
- 15223 Perry Ln
- 225 Spring Ave Unit 5
- 56 Creekside Dr Unit 56
- 42 Dewey Cir
- 445 Barrett Ave
- 15209 Sycamore Dr
- 260 W Dunne Ave Unit 18
- 945 Oak Park Dr
- 815 Oak Park Dr
- 15675 La Bella Ct
- 15655 La Bella Ct
- 15685 La Bella Ct
- 15630 La Bella Ct
- 15645 La Bella Ct
- 15635 La Bella Ct
- 15660 La Bella Ct
- 15695 La Bella Ct
- 15625 La Bella Ct
- 15620 La Bella Ct
- 15860 La Escuela Ct
- 15670 La Sierra Ct
- 15615 La Bella Ct
- 15660 La Sierra Ct
- 15650 La Sierra Ct
- 15610 La Bella Ct
- 15670 La Bella Ct
- 15640 La Sierra Ct
- 15870 La Escuela Ct
- 15605 La Bella Ct