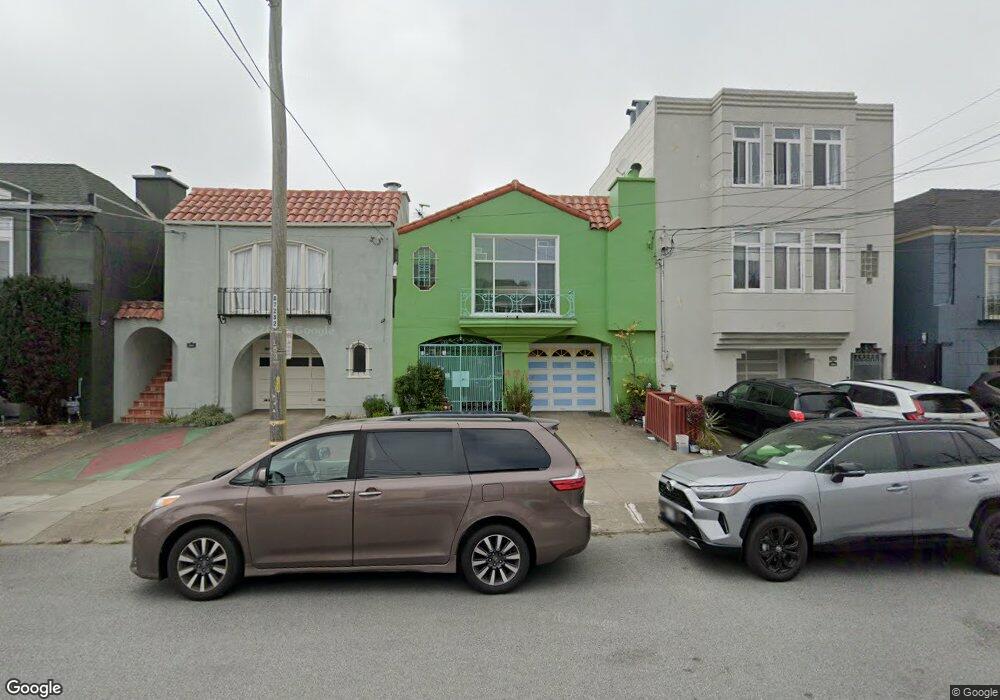
1567 26th Ave San Francisco, CA 94122
Central Sunset NeighborhoodEstimated Value: $1,159,000 - $1,659,000
2
Beds
1
Bath
1,462
Sq Ft
$972/Sq Ft
Est. Value
About This Home
This home is located at 1567 26th Ave, San Francisco, CA 94122 and is currently estimated at $1,421,473, approximately $972 per square foot. 1567 26th Ave is a home located in San Francisco County with nearby schools including Jefferson Elementary School, Giannini (A.P.) Middle School, and Cornerstone Academy-Lawton Campus.
Ownership History
Date
Name
Owned For
Owner Type
Purchase Details
Closed on
Sep 20, 2022
Sold by
Lui Kevin Yu-Chuen and Lui Rebecca
Bought by
Rebecca Lui And Kevin Yu-Chuen Lui Revocable
Current Estimated Value
Purchase Details
Closed on
Feb 18, 2010
Sold by
Lui Yu Chuen
Bought by
Lui Yu Chuen and Lui Rebecca
Home Financials for this Owner
Home Financials are based on the most recent Mortgage that was taken out on this home.
Original Mortgage
$154,000
Interest Rate
5.01%
Mortgage Type
New Conventional
Purchase Details
Closed on
Dec 27, 2002
Sold by
Li Hui Fen
Bought by
Lui Yu Chuen
Home Financials for this Owner
Home Financials are based on the most recent Mortgage that was taken out on this home.
Original Mortgage
$280,000
Interest Rate
6.06%
Purchase Details
Closed on
Jun 14, 1996
Sold by
Lui Yu Chuen and Li Hui Fen
Bought by
Lui Yu Chuen
Create a Home Valuation Report for This Property
The Home Valuation Report is an in-depth analysis detailing your home's value as well as a comparison with similar homes in the area
Home Values in the Area
Average Home Value in this Area
Purchase History
| Date | Buyer | Sale Price | Title Company |
|---|---|---|---|
| Rebecca Lui And Kevin Yu-Chuen Lui Revocable | -- | -- | |
| Lui Yu Chuen | -- | Lsi | |
| Lui Yu Chuen | -- | Chicago Title Company | |
| Lui Yu Chuen | -- | Fidelity National Title Co |
Source: Public Records
Mortgage History
| Date | Status | Borrower | Loan Amount |
|---|---|---|---|
| Previous Owner | Lui Yu Chuen | $154,000 | |
| Previous Owner | Lui Yu Chuen | $280,000 |
Source: Public Records
Tax History Compared to Growth
Tax History
| Year | Tax Paid | Tax Assessment Tax Assessment Total Assessment is a certain percentage of the fair market value that is determined by local assessors to be the total taxable value of land and additions on the property. | Land | Improvement |
|---|---|---|---|---|
| 2025 | $6,186 | $469,932 | $339,924 | $130,008 |
| 2024 | $6,186 | $460,718 | $333,259 | $127,459 |
| 2023 | $6,085 | $451,685 | $326,725 | $124,960 |
| 2022 | $5,956 | $442,800 | $320,306 | $122,494 |
| 2021 | $5,847 | $434,120 | $314,026 | $120,094 |
| 2020 | $5,890 | $429,672 | $310,808 | $118,864 |
| 2019 | $5,692 | $421,248 | $304,714 | $116,534 |
| 2018 | $5,502 | $412,990 | $298,740 | $114,250 |
| 2017 | $5,138 | $404,894 | $292,884 | $112,010 |
| 2016 | $5,033 | $396,956 | $287,142 | $109,814 |
| 2015 | $4,969 | $390,996 | $282,830 | $108,166 |
| 2014 | $4,840 | $383,338 | $277,290 | $106,048 |
Source: Public Records
Map
Nearby Homes
- 1479 27th Ave
- 1458 25th Ave
- 1826 Moraga St
- 1678 24th Ave
- 1726 30th Ave
- 1616 Judah St
- 1688 20th Ave Unit 1688
- 1483 19th Ave
- 2615 Lincoln Way
- 1459 34th Ave
- 1926 31st Ave
- 1822 19th Ave Unit 1
- 1822 19th Ave
- 1822 19th Ave Unit 2
- 1255-1257 19th Ave
- 1815 18th Ave
- 1735 35th Ave
- 1349 17th Ave
- 1200 Ortega St Unit 1202
- 3409-3411 Irving St
- 1571 26th Ave
- 1563 26th Ave Unit 1565
- 1575 26th Ave
- 1559 26th Ave
- 1555 26th Ave
- 1579 26th Ave
- 1551 26th Ave
- 1566 27th Ave
- 1562 27th Ave
- 1570 27th Ave
- 1547 26th Ave
- 1574 27th Ave
- 1558 27th Ave
- 1554 27th Ave
- 2020 Lawton St
- 2026 Lawton St
- 1543 26th Ave
- 2028 Lawton St
- 1550 27th Ave
- 2014 Lawton St Unit 2016