Estimated Value: $1,346,526 - $1,429,000
4
Beds
4
Baths
2,795
Sq Ft
$502/Sq Ft
Est. Value
About This Home
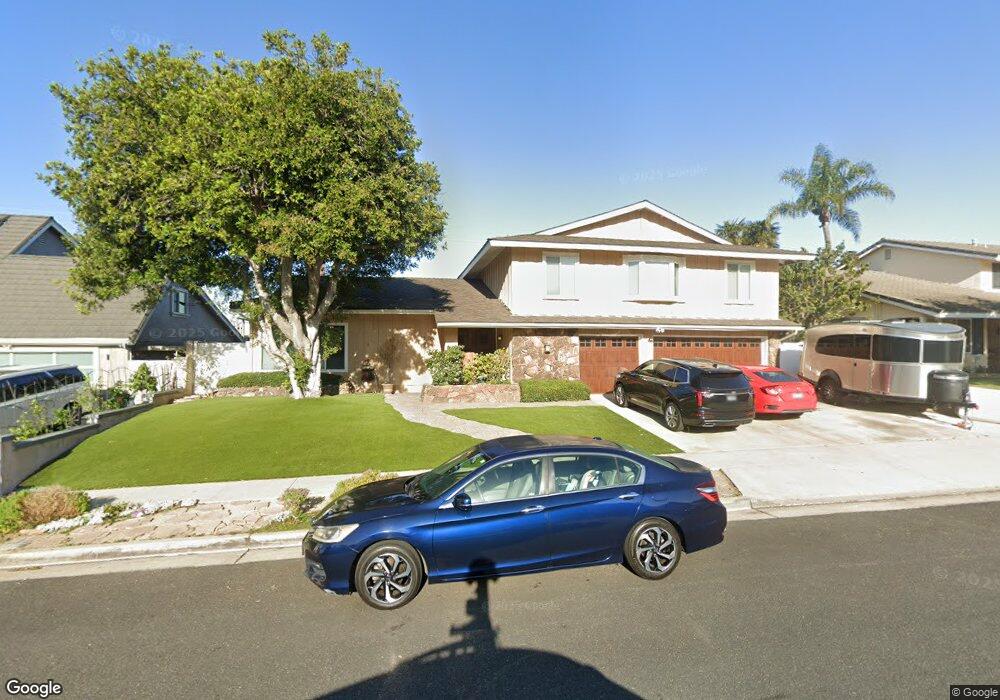
This home is located at 1567 Berenice Dr, Brea, CA 92821 and is currently estimated at $1,404,132, approximately $502 per square foot. 1567 Berenice Dr is a home located in Orange County with nearby schools including Mariposa Elementary School, Brea Junior High School, and Brea-Olinda High School.
Ownership History
Date
Name
Owned For
Owner Type
Purchase Details
Closed on
Feb 20, 2015
Sold by
Jones Jeffery B and Jones Cynthia R
Bought by
Jeffrey & Cynthia Jones Trust Of 2015
Current Estimated Value
Purchase Details
Closed on
Feb 18, 2005
Sold by
Jones Ann S
Bought by
Jones Jeffery B and Jones Cynthia R
Home Financials for this Owner
Home Financials are based on the most recent Mortgage that was taken out on this home.
Original Mortgage
$143,000
Interest Rate
5.66%
Mortgage Type
New Conventional
Purchase Details
Closed on
Dec 20, 2002
Sold by
Jones Ann S
Bought by
Jones Ann S and Ann S Jones Family Trust
Purchase Details
Closed on
Feb 23, 1998
Sold by
Jones Ann S
Bought by
Jones Ann S
Home Financials for this Owner
Home Financials are based on the most recent Mortgage that was taken out on this home.
Original Mortgage
$145,000
Interest Rate
6.99%
Create a Home Valuation Report for This Property
The Home Valuation Report is an in-depth analysis detailing your home's value as well as a comparison with similar homes in the area
Home Values in the Area
Average Home Value in this Area
Purchase History
| Date | Buyer | Sale Price | Title Company |
|---|---|---|---|
| Jeffrey & Cynthia Jones Trust Of 2015 | -- | None Available | |
| Jones Jeffery B | -- | Financial Title Company | |
| Jones Ann S | -- | Fidelity National Title | |
| Jones Ann S | -- | Fidelity National Title Ins |
Source: Public Records
Mortgage History
| Date | Status | Borrower | Loan Amount |
|---|---|---|---|
| Closed | Jones Jeffery B | $143,000 | |
| Closed | Jones Ann S | $145,000 |
Source: Public Records
Tax History
| Year | Tax Paid | Tax Assessment Tax Assessment Total Assessment is a certain percentage of the fair market value that is determined by local assessors to be the total taxable value of land and additions on the property. | Land | Improvement |
|---|---|---|---|---|
| 2025 | $1,894 | $146,898 | $34,149 | $112,749 |
| 2024 | $1,894 | $144,018 | $33,479 | $110,539 |
| 2023 | $1,838 | $141,195 | $32,823 | $108,372 |
| 2022 | $1,814 | $138,427 | $32,179 | $106,248 |
| 2021 | $1,780 | $135,713 | $31,548 | $104,165 |
| 2020 | $1,766 | $134,322 | $31,225 | $103,097 |
| 2019 | $1,725 | $131,689 | $30,613 | $101,076 |
| 2018 | $1,698 | $129,107 | $30,012 | $99,095 |
| 2017 | $1,666 | $126,576 | $29,424 | $97,152 |
| 2016 | $1,634 | $124,095 | $28,847 | $95,248 |
| 2015 | $1,610 | $122,231 | $28,413 | $93,818 |
| 2014 | $1,564 | $119,837 | $27,856 | $91,981 |
Source: Public Records
Map
Nearby Homes
- 18216 Midbury St
- 5621 Alwick Place
- 1060 Tropicana Way
- 1446 Beechwood Dr
- 846 Mooncrest Cir
- 1163 Delay St
- 1401 Havenhurst Dr
- 1142 Delay St
- 530 Palermo Way
- 1011 Delay St
- 740 Laura St
- 900 De Jur St
- 1051 Site Dr Unit 236
- 1051 Site Dr Unit 255
- 1051 Site Dr Unit 25
- 1051 Site Dr Unit 251
- 1051 Site Dr Unit 233
- 1422 Bella Vista Dr
- 470 N Palm St
- 1020 Joyce Dr
- 1571 Berenice Dr
- 1561 Berenice Dr
- 1579 Berenice Dr
- 1557 Berenice Dr
- 1202 Oakcrest Ave
- 1564 Berenice Dr
- 1568 Berenice Dr
- 1205 Birchcrest Ave
- 1576 Berenice Dr
- 1585 Berenice Dr
- 1203 Oakcrest Ave
- 1232 Oakcrest Ave
- 1055 Oakcrest Ave
- 1551 Berenice Dr
- 1580 Berenice Dr
- 1563 N Poinsettia Ave
- 1235 Birchcrest Ave
- 1090 Oakcrest Ave
- 1233 Oakcrest Ave
- 1595 Berenice Dr
Your Personal Tour Guide
Ask me questions while you tour the home.