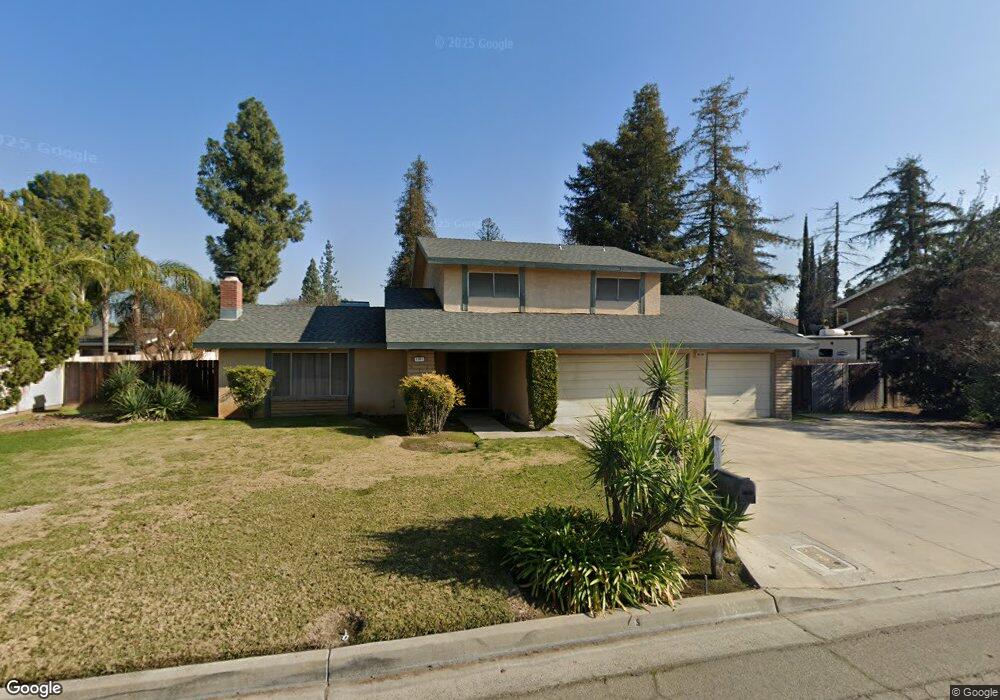
1567 S Sylmar Ave Fresno, CA 93727
Sunnyside NeighborhoodEstimated Value: $463,000 - $491,000
4
Beds
3
Baths
2,122
Sq Ft
$223/Sq Ft
Est. Value
About This Home
This home is located at 1567 S Sylmar Ave, Fresno, CA 93727 and is currently estimated at $473,578, approximately $223 per square foot. 1567 S Sylmar Ave is a home located in Fresno County with nearby schools including Elizabeth Terronez Middle School and Sunnyside High School.
Ownership History
Date
Name
Owned For
Owner Type
Purchase Details
Closed on
Dec 1, 2010
Sold by
Sanders Leonard and Sanders Virginia K
Bought by
Sanders Leonard
Current Estimated Value
Purchase Details
Closed on
Jan 7, 1997
Sold by
Hud
Bought by
Sanders Leonard and Sanders Virginia K
Home Financials for this Owner
Home Financials are based on the most recent Mortgage that was taken out on this home.
Original Mortgage
$101,166
Outstanding Balance
$10,699
Interest Rate
7.46%
Mortgage Type
FHA
Estimated Equity
$462,879
Purchase Details
Closed on
Oct 1, 1996
Sold by
Market Street Mtg Corp
Bought by
Hud
Purchase Details
Closed on
Sep 30, 1996
Sold by
Fisher Letra S
Bought by
Market Street Mtg Corp
Purchase Details
Closed on
Oct 13, 1993
Sold by
Marquez Angie P
Bought by
Fisher Letra S
Home Financials for this Owner
Home Financials are based on the most recent Mortgage that was taken out on this home.
Original Mortgage
$129,316
Interest Rate
6.74%
Mortgage Type
FHA
Create a Home Valuation Report for This Property
The Home Valuation Report is an in-depth analysis detailing your home's value as well as a comparison with similar homes in the area
Home Values in the Area
Average Home Value in this Area
Purchase History
| Date | Buyer | Sale Price | Title Company |
|---|---|---|---|
| Sanders Leonard | -- | None Available | |
| Sanders Leonard | $102,000 | North American Title Co | |
| Hud | -- | Fidelity National Title Ins | |
| Market Street Mtg Corp | -- | Fidelity National Title Ins | |
| Fisher Letra S | $130,000 | Commonwealth Land Title Insu |
Source: Public Records
Mortgage History
| Date | Status | Borrower | Loan Amount |
|---|---|---|---|
| Open | Sanders Leonard | $101,166 | |
| Previous Owner | Fisher Letra S | $129,316 |
Source: Public Records
Tax History Compared to Growth
Tax History
| Year | Tax Paid | Tax Assessment Tax Assessment Total Assessment is a certain percentage of the fair market value that is determined by local assessors to be the total taxable value of land and additions on the property. | Land | Improvement |
|---|---|---|---|---|
| 2025 | $2,000 | $166,095 | $73,273 | $92,822 |
| 2023 | $2,000 | $159,647 | $70,429 | $89,218 |
| 2022 | $1,932 | $156,518 | $69,049 | $87,469 |
| 2021 | $1,878 | $153,450 | $67,696 | $85,754 |
| 2020 | $1,869 | $151,877 | $67,002 | $84,875 |
| 2019 | $1,795 | $148,900 | $65,689 | $83,211 |
| 2018 | $1,755 | $145,981 | $64,401 | $81,580 |
| 2017 | $1,723 | $143,120 | $63,139 | $79,981 |
| 2016 | $1,665 | $140,314 | $61,901 | $78,413 |
| 2015 | $1,639 | $138,208 | $60,972 | $77,236 |
| 2014 | $1,604 | $135,502 | $59,778 | $75,724 |
Source: Public Records
Map
Nearby Homes
- 5221 E Townsend Ave
- 5238 E Townsend Ave
- 1816 S Caesar Ave
- 5173 E Audrie Ave
- 5161 E Audrie Ave
- 5157 E Audrie Ave
- 5145 E Audrie Ave
- 5125 E Audrie Ave
- 2163 S Terry Ave
- 2173 S Sylmar Ave
- 4985 E Butler Ave Unit 109
- 2170 S Sylmar Ave
- 5145 E Lane Ave Unit 252
- Plan 2148 at Peach Street - Edgewood at Peach Avenue
- Plan 2321 Modeled at Peach Street - Edgewood at Peach Avenue
- Plan 2628 at Peach Street - Edgewood at Peach Avenue
- Plan 1860 Modeled at Peach Street - Edgewood at Peach Avenue
- 2194 S Sylmar Ave
- Plan 2155 at Peach Street - Parkside at Peach Avenue
- Plan 1769 Modeled at Peach Street - Parkside at Peach Avenue
- 1535 S Sylmar Ave
- 1603 S Sylmar Ave
- 1566 S Karen Ave
- 1536 S Karen Ave
- 1602 S Karen Ave
- 1564 S Sylmar Ave
- 1534 S Sylmar Ave
- 1604 S Sylmar Ave
- 1635 S Sylmar Ave
- 1634 S Karen Ave
- 1636 S Sylmar Ave
- 5177 E Townsend Ave
- 5167 E Townsend Ave
- 1569 S Bailey Ave
- 1563 S Karen Ave
- 5185 E Townsend Ave
- 1593 S Karen Ave
- 1669 S Sylmar Ave
- 1603 S Bailey Ave
- 1533 S Karen Ave