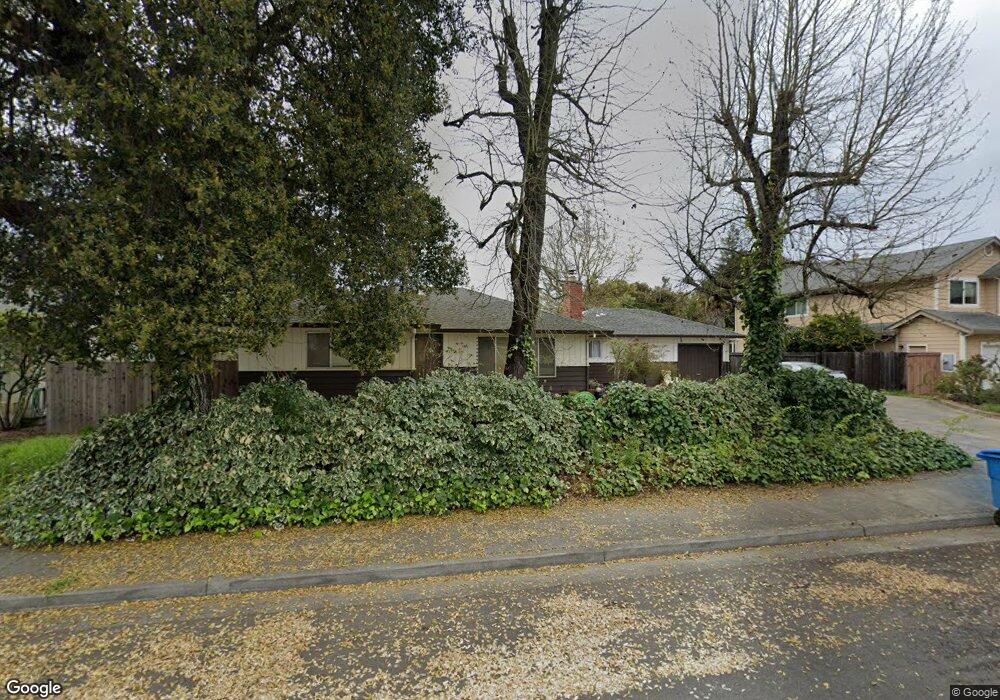
1568 Cabernet Cir Santa Rosa, CA 95403
Northwest Santa Rosa NeighborhoodEstimated Value: $510,000 - $745,067
3
Beds
2
Baths
1,532
Sq Ft
$420/Sq Ft
Est. Value
About This Home
This home is located at 1568 Cabernet Cir, Santa Rosa, CA 95403 and is currently estimated at $642,767, approximately $419 per square foot. 1568 Cabernet Cir is a home located in Sonoma County with nearby schools including Albert F. Biella Elementary School, Hilliard Comstock Middle School, and Santa Rosa High School.
Ownership History
Date
Name
Owned For
Owner Type
Purchase Details
Closed on
Nov 4, 2015
Sold by
White Kathleen and Cia Robert Michael
Bought by
Cia Robert and Cia Teresa
Current Estimated Value
Home Financials for this Owner
Home Financials are based on the most recent Mortgage that was taken out on this home.
Original Mortgage
$231,000
Outstanding Balance
$181,816
Interest Rate
3.81%
Mortgage Type
New Conventional
Estimated Equity
$460,951
Purchase Details
Closed on
Oct 27, 2014
Sold by
White Kathleen and Lee Kathleen Ann
Bought by
White Kathleen and Lee Kathleen Ann
Purchase Details
Closed on
Jan 6, 2014
Sold by
White Kathleen and Heinsen Steven
Bought by
Cia Robert Michael and White Kathleen
Purchase Details
Closed on
Jun 15, 1998
Sold by
Heinsen Robert H and Heinsen Family Trust
Bought by
Heinsen Robert H and Bypass Trust Of The Heinsen Fa
Purchase Details
Closed on
Jan 18, 1994
Sold by
Heinsen Elva Cia
Bought by
Heinsen Elva C
Create a Home Valuation Report for This Property
The Home Valuation Report is an in-depth analysis detailing your home's value as well as a comparison with similar homes in the area
Home Values in the Area
Average Home Value in this Area
Purchase History
| Date | Buyer | Sale Price | Title Company |
|---|---|---|---|
| Cia Robert | $240,000 | First American Title Co | |
| White Kathleen | -- | None Available | |
| Cia Robert Michael | -- | None Available | |
| Heinsen Robert H | -- | -- | |
| Heinsen Elva C | -- | -- |
Source: Public Records
Mortgage History
| Date | Status | Borrower | Loan Amount |
|---|---|---|---|
| Open | Cia Robert | $231,000 |
Source: Public Records
Tax History Compared to Growth
Tax History
| Year | Tax Paid | Tax Assessment Tax Assessment Total Assessment is a certain percentage of the fair market value that is determined by local assessors to be the total taxable value of land and additions on the property. | Land | Improvement |
|---|---|---|---|---|
| 2025 | $3,255 | $280,712 | $98,655 | $182,057 |
| 2024 | $3,255 | $275,209 | $96,721 | $178,488 |
| 2023 | $3,255 | $269,814 | $94,825 | $174,989 |
| 2022 | $3,009 | $264,524 | $92,966 | $171,558 |
| 2021 | $2,967 | $259,339 | $91,144 | $168,195 |
| 2020 | $2,960 | $256,681 | $90,210 | $166,471 |
| 2019 | $2,943 | $251,649 | $88,442 | $163,207 |
| 2018 | $2,925 | $246,715 | $86,708 | $160,007 |
| 2017 | $2,872 | $241,878 | $85,008 | $156,870 |
| 2016 | $2,845 | $237,137 | $83,342 | $153,795 |
| 2015 | $917 | $73,159 | $6,584 | $66,575 |
| 2014 | $864 | $71,727 | $6,456 | $65,271 |
Source: Public Records
Map
Nearby Homes
- 1520 Cabernet Cir
- 2311 Guerneville Rd
- 2318 S Hampton Cir
- 1516 Wadsworth Ct
- 1626 Woodhue Ave
- 1169 Putney Dr
- 2423 Guerneville Rd
- 1380 Velma Ave
- 2291 Truckee Dr
- 141 Stratford Way
- 1532 Pinebrook Place
- 1552 Moonview Ct
- 66 Somerset Dr
- 1905 Belair Way
- 2024 Elson Way
- 2467 College Park Cir
- 1715 Ridley Ave
- 2484 College Park Cir
- 2320 Masterson Ct
- 1721 Jennings Ave
- 1576 Cabernet Cir
- 1564 Cabernet Cir
- 2171 Zinfandel Dr
- 1560 Cabernet Cir
- 1580 Cabernet Cir
- 2165 Zinfandel Dr
- 2254 Guerneville Rd
- 2169 Zinfandel Dr
- 2161 Zinfandel Dr
- 1584 Cabernet Cir
- 1556 Cabernet Cir
- 3311 Zinfandel Ave
- 1571 Cabernet Cir
- 2175 Zinfandel Dr
- 1567 Cabernet Cir
- 1575 Cabernet Cir
- 1579 Cabernet Cir
- 2159 Zinfandel Dr
- 1583 Cabernet Cir
- 2189 Zinfandel Dr