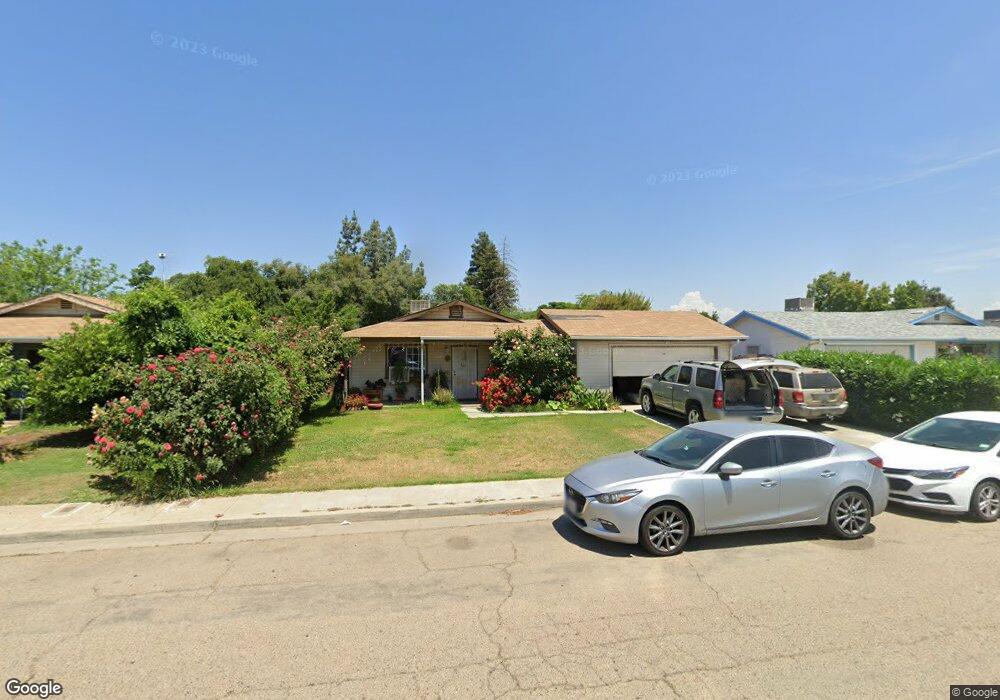
1568 E Jefferson Ave Reedley, CA 93654
Estimated Value: $268,000 - $315,540
3
Beds
2
Baths
1,222
Sq Ft
$241/Sq Ft
Est. Value
About This Home
This home is located at 1568 E Jefferson Ave, Reedley, CA 93654 and is currently estimated at $294,135, approximately $240 per square foot. 1568 E Jefferson Ave is a home located in Fresno County with nearby schools including Silas Bartsch School, Reedley High School, and Immanuel High School.
Ownership History
Date
Name
Owned For
Owner Type
Purchase Details
Closed on
Sep 29, 2004
Sold by
Vega Antonia
Bought by
Salinas Anselmo
Current Estimated Value
Purchase Details
Closed on
Feb 26, 2003
Sold by
Sico Charito P
Bought by
Salinas Anselmo and Vega Antonia
Home Financials for this Owner
Home Financials are based on the most recent Mortgage that was taken out on this home.
Original Mortgage
$104,068
Interest Rate
5.72%
Mortgage Type
FHA
Purchase Details
Closed on
Nov 8, 1995
Sold by
Sico Raymundo C and Sico Charito P
Bought by
Sico Ray C and Sico Charito P
Purchase Details
Closed on
Sep 16, 1994
Sold by
Threlkeld Thacher
Bought by
Sico Raymundo C and Sico Charito P
Home Financials for this Owner
Home Financials are based on the most recent Mortgage that was taken out on this home.
Original Mortgage
$80,855
Interest Rate
8.07%
Mortgage Type
Assumption
Create a Home Valuation Report for This Property
The Home Valuation Report is an in-depth analysis detailing your home's value as well as a comparison with similar homes in the area
Home Values in the Area
Average Home Value in this Area
Purchase History
| Date | Buyer | Sale Price | Title Company |
|---|---|---|---|
| Salinas Anselmo | -- | -- | |
| Salinas Anselmo | $105,000 | First American Title Ins Co | |
| Sico Ray C | -- | -- | |
| Sico Raymundo C | $78,500 | Stewart Title |
Source: Public Records
Mortgage History
| Date | Status | Borrower | Loan Amount |
|---|---|---|---|
| Previous Owner | Salinas Anselmo | $104,068 | |
| Previous Owner | Sico Raymundo C | $80,855 |
Source: Public Records
Tax History Compared to Growth
Tax History
| Year | Tax Paid | Tax Assessment Tax Assessment Total Assessment is a certain percentage of the fair market value that is determined by local assessors to be the total taxable value of land and additions on the property. | Land | Improvement |
|---|---|---|---|---|
| 2025 | $2,079 | $180,558 | $63,666 | $116,892 |
| 2023 | $2,053 | $173,548 | $61,195 | $112,353 |
| 2022 | $2,057 | $170,146 | $59,996 | $110,150 |
| 2021 | $1,756 | $145,600 | $37,400 | $108,200 |
| 2020 | $1,775 | $144,200 | $37,100 | $107,100 |
| 2019 | $1,725 | $141,400 | $36,400 | $105,000 |
| 2018 | $1,725 | $138,700 | $35,700 | $103,000 |
| 2017 | $1,642 | $136,000 | $35,000 | $101,000 |
| 2016 | $1,791 | $142,946 | $50,356 | $92,590 |
| 2015 | $1,729 | $140,800 | $49,600 | $91,200 |
| 2014 | $1,680 | $134,200 | $47,300 | $86,900 |
Source: Public Records
Map
Nearby Homes
- 1423 E Evening Glow Ave
- 1590 E Dinuba Ave
- 1967 E Lingo Ave
- 1570 E Dinuba Ave
- 208 S Orange Ave
- 2215 E Washington Ave
- 792 E Duff Ave
- 216 S Sunset Ave
- 1966 E August Ave
- 1205 F St
- 437 E Stanley Ave
- 1010 D St
- 1405 E Cypress Ave Unit 157
- 1405 E Cypress Ave Unit 217
- 1405 E Cypress Ave Unit 137
- 2043 11th St
- 957 S Hope Ave
- 1034 L St
- 19317 E Parlier Ave
- 238 W Cypress Ave
- 1590 E Jefferson Ave
- 1548 E Jefferson Ave
- 1575 E Duff Ave
- 1620 E Jefferson Ave
- 1589 E Duff Ave
- 20702 E Jefferson Ave
- 1567 E Jefferson Ave
- 1589 E Jefferson Ave
- 1642 E Jefferson Ave
- 1545 E Jefferson Ave
- 1621 E Duff Ave
- 1619 E Jefferson Ave
- 545 S Cedar Ave
- 567 S Cedar Ave
- 529 S Cedar Ave
- 589 S Cedar Ave
- 1641 E Jefferson Ave
- 1664 E Jefferson Ave
- 1645 E Duff Ave
- 509 S Cedar Ave