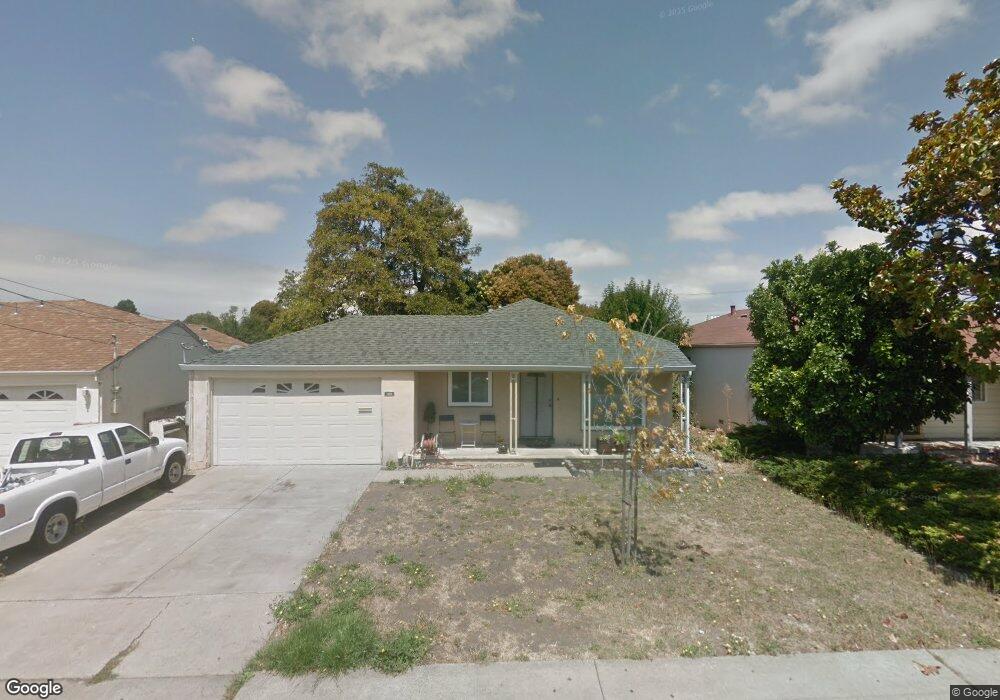
1569 Bandoni Ave San Lorenzo, CA 94580
Estimated Value: $737,000 - $829,000
3
Beds
1
Bath
1,050
Sq Ft
$744/Sq Ft
Est. Value
About This Home
This home is located at 1569 Bandoni Ave, San Lorenzo, CA 94580 and is currently estimated at $781,196, approximately $743 per square foot. 1569 Bandoni Ave is a home located in Alameda County with nearby schools including Del Rey Elementary School, Bohannon Middle School, and Arroyo High School.
Ownership History
Date
Name
Owned For
Owner Type
Purchase Details
Closed on
Feb 12, 2014
Sold by
Faria Gina and Crotti Gina
Bought by
Faria Gina and Faria Craig
Current Estimated Value
Home Financials for this Owner
Home Financials are based on the most recent Mortgage that was taken out on this home.
Original Mortgage
$275,000
Outstanding Balance
$208,856
Interest Rate
4.47%
Mortgage Type
New Conventional
Estimated Equity
$572,340
Purchase Details
Closed on
May 8, 2004
Sold by
Crotti Gabriel and Crotti Patricia
Bought by
Crotti Gina
Purchase Details
Closed on
Feb 25, 2003
Sold by
Clark Leslie and Clark Trust
Bought by
Crotti Gabriel and Crotti Patricia
Home Financials for this Owner
Home Financials are based on the most recent Mortgage that was taken out on this home.
Original Mortgage
$289,750
Interest Rate
5.93%
Create a Home Valuation Report for This Property
The Home Valuation Report is an in-depth analysis detailing your home's value as well as a comparison with similar homes in the area
Home Values in the Area
Average Home Value in this Area
Purchase History
| Date | Buyer | Sale Price | Title Company |
|---|---|---|---|
| Faria Gina | -- | Old Republic Title Company | |
| Crotti Gina | -- | -- | |
| Crotti Gabriel | $305,000 | Old Republic Title Company |
Source: Public Records
Mortgage History
| Date | Status | Borrower | Loan Amount |
|---|---|---|---|
| Open | Faria Gina | $275,000 | |
| Closed | Crotti Gabriel | $289,750 |
Source: Public Records
Tax History Compared to Growth
Tax History
| Year | Tax Paid | Tax Assessment Tax Assessment Total Assessment is a certain percentage of the fair market value that is determined by local assessors to be the total taxable value of land and additions on the property. | Land | Improvement |
|---|---|---|---|---|
| 2025 | $5,854 | $434,700 | $132,510 | $309,190 |
| 2024 | $5,854 | $426,041 | $129,912 | $303,129 |
| 2023 | $5,830 | $424,553 | $127,366 | $297,187 |
| 2022 | $5,738 | $409,230 | $124,869 | $291,361 |
| 2021 | $5,578 | $401,071 | $122,421 | $285,650 |
| 2020 | $5,454 | $403,890 | $121,167 | $282,723 |
| 2019 | $5,457 | $395,971 | $118,791 | $277,180 |
| 2018 | $5,141 | $388,210 | $116,463 | $271,747 |
| 2017 | $4,907 | $380,600 | $114,180 | $266,420 |
| 2016 | $4,680 | $373,140 | $111,942 | $261,198 |
| 2015 | $4,577 | $367,537 | $110,261 | $257,276 |
| 2014 | $4,509 | $360,338 | $108,101 | $252,237 |
Source: Public Records
Map
Nearby Homes
- 1608 Keller Ave
- 1575 Via Lucas
- 1766 Via Redondo
- 1311 Via Manzanas
- 17069 Via Chiquita
- 1338 Via la Paloma
- 1867 Via Buena Vista
- 1631 Via Ventana
- 17354 Via el Cerrito
- 1655 Via Escondido
- 16050 Via Olinda
- 1781 Via Rancho
- 15967 Paseo Del Campo
- 0 E 14th St Unit 41059501
- 16011 Via Conejo
- 15771 Via Nueva
- 17316 Via Flores
- 17347 Via Encinas
- 18003 Incline Place
- 18018 Sahara Rd
- 1579 Bandoni Ave
- 1559 Bandoni Ave
- 1589 Bandoni Ave
- 1549 Bandoni Ave
- 1580 Bockman Rd
- 1628 Keller Ave
- 1568 Bandoni Ave
- 1578 Bandoni Ave
- 1558 Bandoni Ave
- 1540 Bockman Rd
- 1588 Bandoni Ave
- 1638 Keller Ave
- 1548 Bandoni Ave
- 1603 Bandoni Ave
- 1538 Bandoni Ave
- 1598 Bandoni Ave
- 1648 Keller Ave
- 1619 Bandoni Ave
- 1528 Bandoni Ave
- 17200 Via Melina