Estimated Value: $155,000 - $194,000
3
Beds
1
Bath
900
Sq Ft
$190/Sq Ft
Est. Value
About This Home
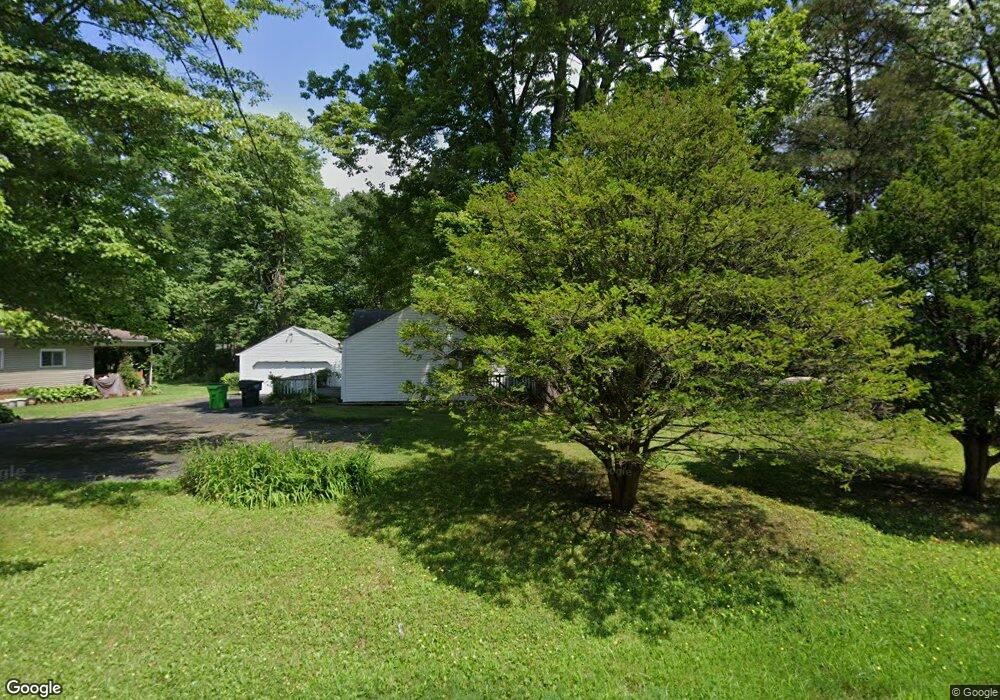
This home is located at 1569 Hibbard Dr, Stow, OH 44224 and is currently estimated at $171,284, approximately $190 per square foot. 1569 Hibbard Dr is a home located in Summit County with nearby schools including Stow-Munroe Falls High School, Primrose School of Hudson, and Holy Family Elementary School.
Ownership History
Date
Name
Owned For
Owner Type
Purchase Details
Closed on
Aug 19, 2004
Sold by
Commercial Interinsurance Agents Inc
Bought by
Mcelroy Bradley T
Current Estimated Value
Home Financials for this Owner
Home Financials are based on the most recent Mortgage that was taken out on this home.
Original Mortgage
$109,000
Outstanding Balance
$54,410
Interest Rate
6.1%
Mortgage Type
VA
Estimated Equity
$116,874
Purchase Details
Closed on
Feb 20, 2003
Sold by
Deshon William C
Bought by
Commercial Interinsurance Agents Inc
Purchase Details
Closed on
May 30, 2000
Sold by
Vitale Russell A and Vitale Michael A
Bought by
Deshon William C
Home Financials for this Owner
Home Financials are based on the most recent Mortgage that was taken out on this home.
Original Mortgage
$99,000
Interest Rate
8.18%
Create a Home Valuation Report for This Property
The Home Valuation Report is an in-depth analysis detailing your home's value as well as a comparison with similar homes in the area
Home Values in the Area
Average Home Value in this Area
Purchase History
| Date | Buyer | Sale Price | Title Company |
|---|---|---|---|
| Mcelroy Bradley T | $109,000 | Real Living Title Agency Ltd | |
| Commercial Interinsurance Agents Inc | $64,000 | Endress/Lawyers Title | |
| Deshon William C | $110,000 | Gateway Title Service Agency |
Source: Public Records
Mortgage History
| Date | Status | Borrower | Loan Amount |
|---|---|---|---|
| Open | Mcelroy Bradley T | $109,000 | |
| Previous Owner | Deshon William C | $99,000 |
Source: Public Records
Tax History Compared to Growth
Tax History
| Year | Tax Paid | Tax Assessment Tax Assessment Total Assessment is a certain percentage of the fair market value that is determined by local assessors to be the total taxable value of land and additions on the property. | Land | Improvement |
|---|---|---|---|---|
| 2025 | $2,221 | $38,791 | $10,945 | $27,846 |
| 2024 | $2,221 | $38,791 | $10,945 | $27,846 |
| 2023 | $2,221 | $38,791 | $10,945 | $27,846 |
| 2022 | $2,073 | $31,924 | $8,901 | $23,023 |
| 2021 | $1,859 | $31,924 | $8,901 | $23,023 |
| 2020 | $1,828 | $31,920 | $8,900 | $23,020 |
| 2019 | $1,937 | $31,680 | $8,900 | $22,780 |
| 2018 | $1,906 | $31,680 | $8,900 | $22,780 |
| 2017 | $1,958 | $31,680 | $8,900 | $22,780 |
| 2016 | $2,015 | $31,680 | $8,900 | $22,780 |
| 2015 | $1,958 | $31,680 | $8,900 | $22,780 |
| 2014 | $1,960 | $31,680 | $8,900 | $22,780 |
| 2013 | $2,013 | $32,770 | $8,900 | $23,870 |
Source: Public Records
Map
Nearby Homes
- 0 Hibbard Dr
- 1470 Mac Dr
- 4877 Cedar Crest Ln
- 1808 Higby Dr Unit A
- 4891 Cedar Crest Ln
- 1664 Cypress Ct
- 1511 Apollo Dr
- 1627 Cypress Ct
- 1938 Higby Dr
- V/L Lawnmark Dr
- 4630 Red Willow Rd
- V/L Housley Rd
- 1620 Sapphire Dr
- 1884 Village Ct Unit X66
- 1759 E Sapphire Dr
- V/L Norton Rd
- 2140 Woodlawn Cir Unit 2144
- 2327 Crockett Cir
- 0 Stow Rd Unit 5102979
- 2380 Port Williams Dr Unit 2380
- 1559 Hibbard Dr
- 1579 Hibbard Dr
- 1549 Hibbard Dr
- 1589 Hibbard Dr
- 1470 Meadowbrook Blvd
- 1460 Meadowbrook Blvd
- 1480 Meadowbrook Blvd
- 1568 Hibbard Dr
- 1450 Meadowbrook Blvd
- 1539 Hibbard Dr
- 132 Meadowbrook Blvd
- 1490 Meadowbrook Blvd
- 4721 Montrose Dr
- 1594 Gangl Dr
- 4700 Montrose Dr
- 1475 Meadowbrook Blvd
- 1500 Meadowbrook Blvd
- 1459 Meadowbrook Blvd
- 1534 Hibbard Dr
- 1613 Hibbard Dr