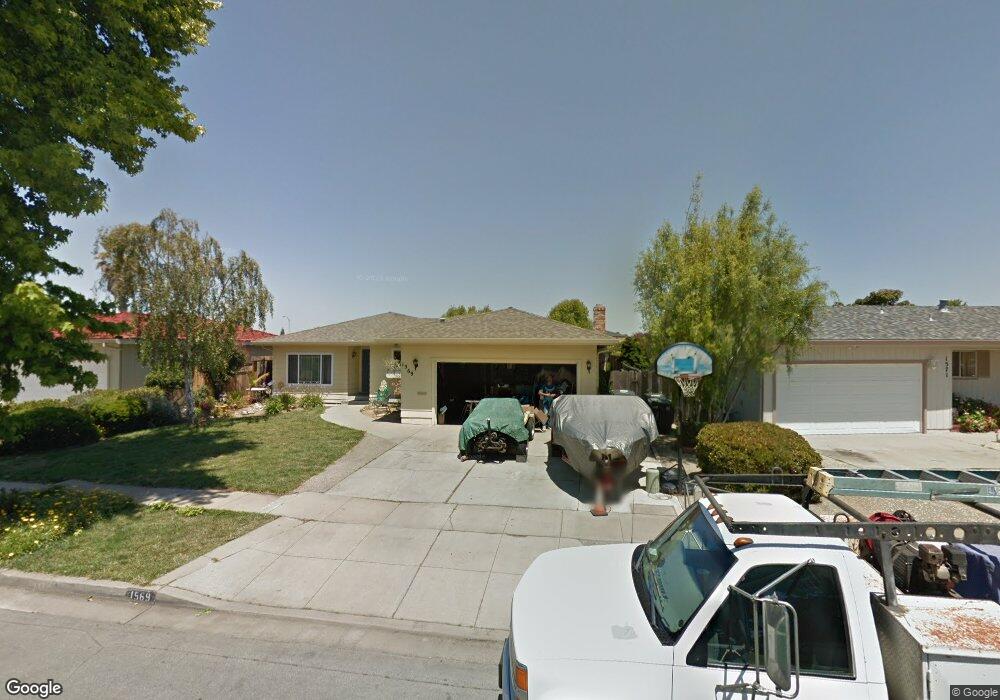
1569 Los Altos Way Unit 5 Salinas, CA 93906
Creekbridge NeighborhoodEstimated Value: $715,000 - $748,000
3
Beds
2
Baths
1,522
Sq Ft
$480/Sq Ft
Est. Value
About This Home
This home is located at 1569 Los Altos Way Unit 5, Salinas, CA 93906 and is currently estimated at $730,440, approximately $479 per square foot. 1569 Los Altos Way Unit 5 is a home located in Monterey County with nearby schools including Loma Vista Elementary School, Natividad Elementary School, and El Gabilan Elementary School.
Ownership History
Date
Name
Owned For
Owner Type
Purchase Details
Closed on
Nov 12, 1999
Sold by
Chavez Manuel M and Chavez Herlinda E
Bought by
Rosas Arthur G and Rosas Susan M
Current Estimated Value
Home Financials for this Owner
Home Financials are based on the most recent Mortgage that was taken out on this home.
Original Mortgage
$162,500
Outstanding Balance
$37,294
Interest Rate
4.45%
Estimated Equity
$693,146
Purchase Details
Closed on
Dec 19, 1995
Sold by
Williams James Harden and Williams Jewell Marie
Bought by
Chavez Manuel M and Chavez Herlinda E
Home Financials for this Owner
Home Financials are based on the most recent Mortgage that was taken out on this home.
Original Mortgage
$175,750
Interest Rate
7.38%
Create a Home Valuation Report for This Property
The Home Valuation Report is an in-depth analysis detailing your home's value as well as a comparison with similar homes in the area
Home Values in the Area
Average Home Value in this Area
Purchase History
| Date | Buyer | Sale Price | Title Company |
|---|---|---|---|
| Rosas Arthur G | $182,500 | First American Title | |
| Chavez Manuel M | $185,000 | Old Republic Title Company |
Source: Public Records
Mortgage History
| Date | Status | Borrower | Loan Amount |
|---|---|---|---|
| Open | Rosas Arthur G | $162,500 | |
| Previous Owner | Chavez Manuel M | $175,750 | |
| Closed | Rosas Arthur G | $40,000 |
Source: Public Records
Tax History Compared to Growth
Tax History
| Year | Tax Paid | Tax Assessment Tax Assessment Total Assessment is a certain percentage of the fair market value that is determined by local assessors to be the total taxable value of land and additions on the property. | Land | Improvement |
|---|---|---|---|---|
| 2025 | $3,160 | $280,478 | $130,634 | $149,844 |
| 2024 | $3,160 | $274,979 | $128,073 | $146,906 |
| 2023 | $3,053 | $269,588 | $125,562 | $144,026 |
| 2022 | $2,937 | $264,302 | $123,100 | $141,202 |
| 2021 | $2,820 | $259,121 | $120,687 | $138,434 |
| 2020 | $2,741 | $256,465 | $119,450 | $137,015 |
| 2019 | $2,719 | $251,437 | $117,108 | $134,329 |
| 2018 | $2,682 | $246,508 | $114,812 | $131,696 |
| 2017 | $2,683 | $241,675 | $112,561 | $129,114 |
| 2016 | $2,683 | $236,937 | $110,354 | $126,583 |
| 2015 | $2,705 | $233,379 | $108,697 | $124,682 |
| 2014 | $2,523 | $228,808 | $106,568 | $122,240 |
Source: Public Records
Map
Nearby Homes
- 1527 Atherton Way
- 728 Saratoga Dr Unit 1
- 634 Yreka Dr
- 522 E Alvin Dr
- 607 Calaveras Dr
- 1780 Truckee Way
- 1260 Trazado Ave
- 458 Rainier Dr
- 1049 Twin Creeks Dr
- 453 Chaparral St
- 18 Suffield Cir
- 1818 Lancashire Dr
- 1238 Granada Ave
- 1443 Parsons Ave
- 1421 Amador Cir
- 16 Wimbledon Cir
- 1139 Cape Cod Way
- 383 Natividad Rd
- 709 Gee St
- 914 Acosta Plaza Unit 32
- 1565 Los Altos Way
- 1571 Los Altos Way
- 1552 Menlo Way
- 1548 Menlo Way
- 1575 Los Altos Way
- 1561 Los Altos Way
- 1556 Menlo Way
- 1544 Menlo Way
- 1570 Los Altos Way Unit 5
- 1564 Los Altos Way
- 1577 Los Altos Way
- 1572 Los Altos Way
- 1560 Menlo Way
- 1547 Los Altos Way
- 1560 Los Altos Way
- 1576 Los Altos Way
- 1564 Menlo Way
- 1581 Los Altos Way
- 1580 Los Altos Way
- 1551 Menlo Way