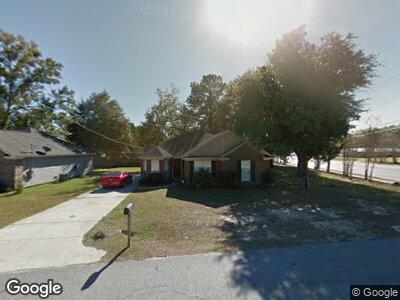
1569 Tallahassee Dr Mobile, AL 36605
Bayview NeighborhoodEstimated Value: $143,000 - $166,000
3
Beds
2
Baths
1,392
Sq Ft
$110/Sq Ft
Est. Value
About This Home
This home is located at 1569 Tallahassee Dr, Mobile, AL 36605 and is currently estimated at $152,703, approximately $109 per square foot. 1569 Tallahassee Dr is a home located in Mobile County with nearby schools including Dr. Robert W. Gilliard Elementary School and Ben C Rain High School.
Ownership History
Date
Name
Owned For
Owner Type
Purchase Details
Closed on
May 22, 2020
Sold by
Kennan Delores and Campbel Lerob
Bought by
Kenan Delores
Current Estimated Value
Purchase Details
Closed on
May 20, 2014
Sold by
Kenan Delores
Bought by
Camphell Lerob
Purchase Details
Closed on
Jul 2, 2010
Sold by
Campbell Lerob
Bought by
Campbell Lerob and Kenan Delores
Home Financials for this Owner
Home Financials are based on the most recent Mortgage that was taken out on this home.
Original Mortgage
$104,492
Interest Rate
5.02%
Mortgage Type
FHA
Purchase Details
Closed on
May 21, 2010
Sold by
Selwonk Enterprises Inc
Bought by
Campbell Lerob
Home Financials for this Owner
Home Financials are based on the most recent Mortgage that was taken out on this home.
Original Mortgage
$104,492
Interest Rate
5.02%
Mortgage Type
FHA
Purchase Details
Closed on
Jan 17, 2008
Sold by
Temonia Ruth Angelo
Bought by
Selwonk Enterprises Inc
Create a Home Valuation Report for This Property
The Home Valuation Report is an in-depth analysis detailing your home's value as well as a comparison with similar homes in the area
Home Values in the Area
Average Home Value in this Area
Purchase History
| Date | Buyer | Sale Price | Title Company |
|---|---|---|---|
| Kenan Delores | -- | None Available | |
| Camphell Lerob | $92,500 | None Available | |
| Campbell Lerob | -- | None Available | |
| Campbell Lerob | $105,900 | None Available | |
| Selwonk Enterprises Inc | $35,000 | None Available | |
| Selwonk Enterprises Inc | -- | None Available |
Source: Public Records
Mortgage History
| Date | Status | Borrower | Loan Amount |
|---|---|---|---|
| Previous Owner | Campbell Lerob | $104,492 | |
| Previous Owner | Campbell Lerob | $3,177 |
Source: Public Records
Tax History Compared to Growth
Tax History
| Year | Tax Paid | Tax Assessment Tax Assessment Total Assessment is a certain percentage of the fair market value that is determined by local assessors to be the total taxable value of land and additions on the property. | Land | Improvement |
|---|---|---|---|---|
| 2024 | $515 | $8,990 | $1,300 | $7,690 |
| 2023 | $508 | $9,040 | $1,270 | $7,770 |
| 2022 | $518 | $9,220 | $1,260 | $7,960 |
| 2021 | $550 | $9,700 | $1,650 | $8,050 |
| 2020 | $1,237 | $9,740 | $1,500 | $8,240 |
| 2019 | $1,247 | $19,640 | $0 | $0 |
| 2018 | $1,270 | $20,000 | $0 | $0 |
| 2017 | $581 | $10,200 | $0 | $0 |
| 2016 | $586 | $10,280 | $0 | $0 |
| 2013 | -- | $8,980 | $0 | $0 |
Source: Public Records
Map
Nearby Homes
- 3256 Dauphin Island Pkwy
- 1428 Tampa Dr
- 1431 Cedar Park Dr
- 1625 Bryan Ave
- 1708 Bryan Ave
- 3035 Dauphin Island Pkwy
- 1853 Brill Cir
- 3016 W Curry Dr
- 1614 Wardwood Dr
- 1909 Riverside Dr
- 1953 Brill Rd
- 3022 Pickell Dr
- 0 Dunnaway Dr
- 2903 Alston Ct
- 4460 Dauphin Island Pkwy
- 1758 Dauphin Island Pkwy
- 0 Hannon Rd Unit 2 0501554
- 1178 S Forest Glen Dr S
- 0 Dauphin Island Pkwy Unit 7280348
- 0 Dauphin Island Pkwy Unit 351970
- 1569 Tallahassee Dr
- 1570 Cedar Crescent Dr Unit C
- 1570 Cedar Crescent Dr
- 1566 Cedar Crescent Dr Unit D
- 1566 Cedar Crescent Dr
- 1561 Tallahassee Dr
- 1562 Cedar Crescent Dr
- 1564 Tallahassee Dr
- 1557 Tallahassee Dr
- 1560 Tallahassee Dr
- 1560 Tallahassee Dr Unit 2
- 1558 Cedar Crescent Dr
- 1558 Tallahassee Dr
- 3252 Dauphin Island Pkwy
- 1555 Tallahassee Dr
- 1556 Tallahassee Dr
- 3303 Dauphin Island Pkwy
- 3254 Ponce de Leon Dr
- 1561 Cedar Crescent Dr
- 1553 Tallahassee Dr