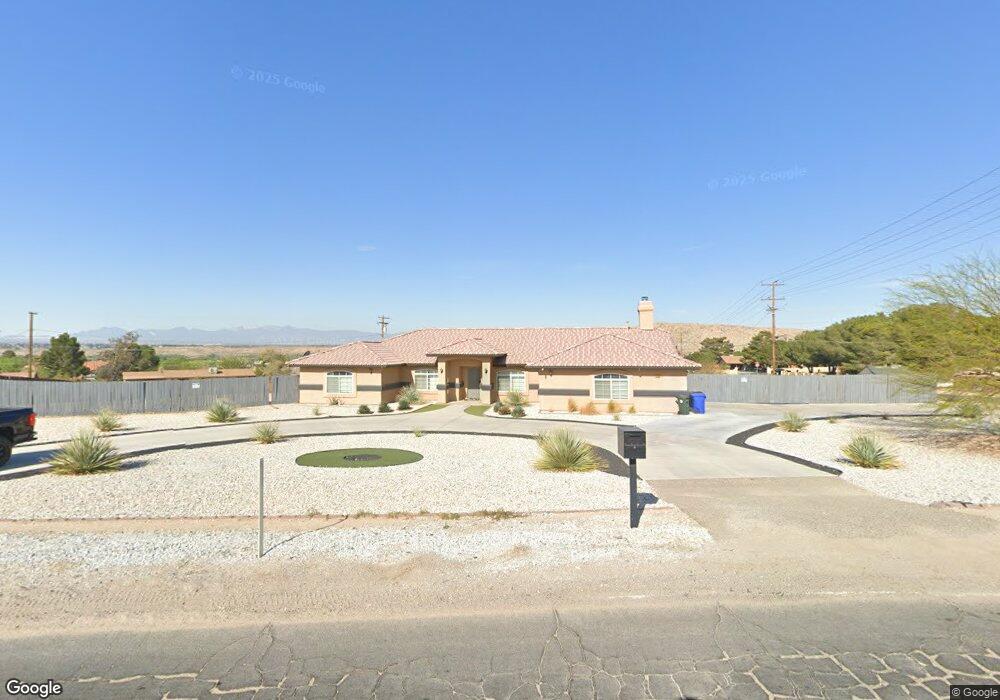
15690 Kasota Rd Apple Valley, CA 92307
High Desert NeighborhoodEstimated Value: $491,000 - $572,000
4
Beds
3
Baths
2,678
Sq Ft
$198/Sq Ft
Est. Value
About This Home
This home is located at 15690 Kasota Rd, Apple Valley, CA 92307 and is currently estimated at $529,709, approximately $197 per square foot. 15690 Kasota Rd is a home located in San Bernardino County with nearby schools including Desert Knolls Elementary School, Granite Hills High School, and Academy for Academic Excellence.
Ownership History
Date
Name
Owned For
Owner Type
Purchase Details
Closed on
Dec 3, 2011
Sold by
Oh Mee H
Bought by
Shin Dong Jin
Current Estimated Value
Purchase Details
Closed on
Dec 2, 2011
Sold by
Federal National Mortgage Association
Bought by
Shin Dong Jin
Purchase Details
Closed on
Sep 3, 2010
Sold by
Hanna Robert S
Bought by
Federal National Mortgage Association
Purchase Details
Closed on
Oct 5, 2005
Sold by
Jimenez Joe
Bought by
Hanna Robert S and Hanna Collette D
Home Financials for this Owner
Home Financials are based on the most recent Mortgage that was taken out on this home.
Original Mortgage
$335,500
Interest Rate
5.68%
Mortgage Type
Fannie Mae Freddie Mac
Purchase Details
Closed on
Apr 13, 2004
Sold by
Jimenez Tina
Bought by
Jimenez Joe
Purchase Details
Closed on
Mar 12, 2004
Sold by
East Jay A
Bought by
Jimenez Joe
Purchase Details
Closed on
Apr 3, 2002
Sold by
East Jay A
Bought by
East Jay A and East Donna L
Create a Home Valuation Report for This Property
The Home Valuation Report is an in-depth analysis detailing your home's value as well as a comparison with similar homes in the area
Home Values in the Area
Average Home Value in this Area
Purchase History
| Date | Buyer | Sale Price | Title Company |
|---|---|---|---|
| Shin Dong Jin | -- | Spl Title Services | |
| Shin Dong Jin | $150,500 | Servicelink | |
| Federal National Mortgage Association | $271,992 | Landsafe Default | |
| Hanna Robert S | $362,000 | First American Jp | |
| Jimenez Joe | -- | First American | |
| Jimenez Joe | $75,000 | First American | |
| East Jay A | -- | -- |
Source: Public Records
Mortgage History
| Date | Status | Borrower | Loan Amount |
|---|---|---|---|
| Previous Owner | Hanna Robert S | $335,500 |
Source: Public Records
Tax History Compared to Growth
Tax History
| Year | Tax Paid | Tax Assessment Tax Assessment Total Assessment is a certain percentage of the fair market value that is determined by local assessors to be the total taxable value of land and additions on the property. | Land | Improvement |
|---|---|---|---|---|
| 2025 | $2,202 | $189,036 | $31,402 | $157,634 |
| 2024 | $2,202 | $185,329 | $30,786 | $154,543 |
| 2023 | $2,182 | $181,695 | $30,182 | $151,513 |
| 2022 | $2,149 | $178,132 | $29,590 | $148,542 |
| 2021 | $2,100 | $174,639 | $29,010 | $145,629 |
| 2020 | $2,074 | $172,849 | $28,713 | $144,136 |
| 2019 | $2,036 | $169,460 | $28,150 | $141,310 |
| 2018 | $1,986 | $166,137 | $27,598 | $138,539 |
| 2017 | $1,959 | $162,880 | $27,057 | $135,823 |
| 2016 | $1,868 | $159,686 | $26,526 | $133,160 |
| 2015 | $1,840 | $157,288 | $26,128 | $131,160 |
| 2014 | $1,816 | $154,207 | $25,616 | $128,591 |
Source: Public Records
Map
Nearby Homes
- 15598 Apple Valley Rd
- 15615 Tuscola Rd
- 0 Tuscola Rd Unit HD25118626
- 0 Tuscola Rd Unit HD25200058
- 18425 Owatonna Rd
- 0 S Outer Hwy 18 Unit HD24234601
- 17993 Mondamon Rd
- 0 Apple Valley Rd Unit HD25118580
- 0 Apple Valley Rd Unit HD24134029
- 0 Apple Valley Rd Unit HD25018407
- 0 Apple Valley Rd Unit SR25169310
- 15675 Pohez Rd
- 0 Kasota Rd Unit HD25183847
- 0 Wato Rd
- 0 Potomac Rd Unit SW25054568
- 18080 Manitou Rd
- 47339211 Kokanee Rd
- 17795 Branding Iron Rd
- 18539 Symeron Rd
- 15194 Tacony Rd
- 15676 Kasota Rd
- 15641 Apple Valley Rd
- 15730 Kasota Rd
- 18221 Owatonna Rd
- 15659 Apple Valley Rd
- 15625 Apple Valley Rd
- 15727 Tuscola Rd Unit 1
- 15727 Tuscola Rd
- 15658 Kasota Rd
- 15717 Kasota Rd
- 0 Owatonna Rd
- 15745 Kasota Rd
- 15615 Apple Valley Rd
- 15740 Kasota Rd
- 15655 Kasota Rd
- 15686 Tuscola Rd
- 18251 Owatonna Rd
- 18242 Owatonna Rd
- 15757 Tuscola Rd Unit 6
- 15757 Tuscola Rd