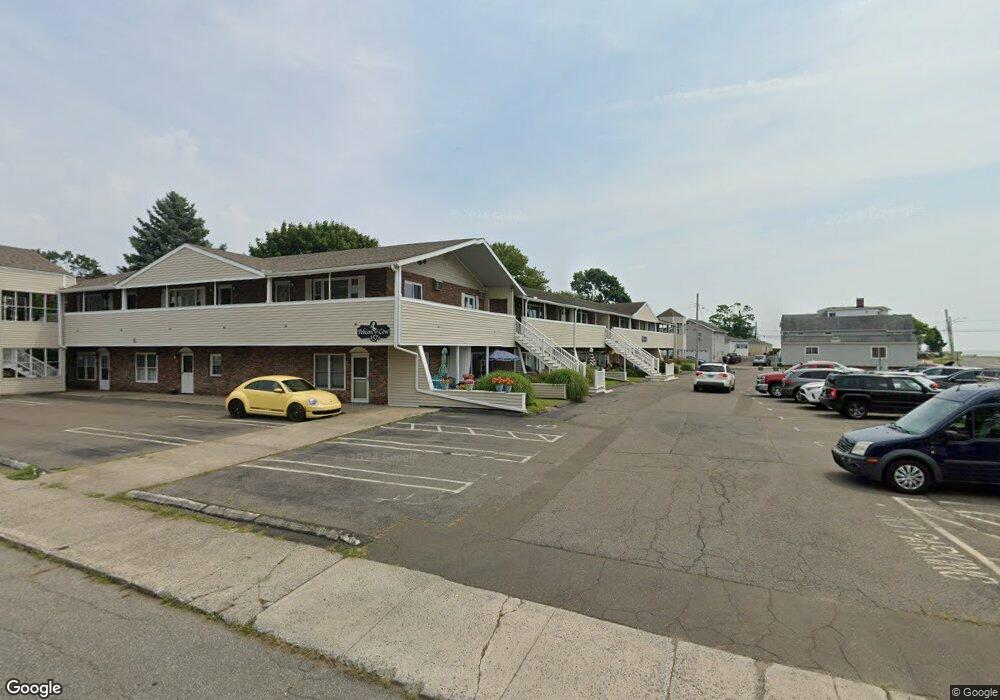
157 1/2 Kings Hwy Unit A Milford, CT 06460
Woodmont NeighborhoodEstimated Value: $225,944 - $306,000
1
Bed
1
Bath
613
Sq Ft
$433/Sq Ft
Est. Value
About This Home
This home is located at 157 1/2 Kings Hwy Unit A, Milford, CT 06460 and is currently estimated at $265,486, approximately $433 per square foot. 157 1/2 Kings Hwy Unit A is a home located in New Haven County with nearby schools including Live Oaks School, East Shore Middle School, and Joseph A. Foran High School.
Ownership History
Date
Name
Owned For
Owner Type
Purchase Details
Closed on
Feb 21, 2020
Sold by
Krupienski Jonathan E
Bought by
Krupienski Timothy R
Current Estimated Value
Purchase Details
Closed on
Jul 15, 2013
Sold by
Gabriel Lee F Est and Gabriel
Bought by
Krupienski Jonathan E
Home Financials for this Owner
Home Financials are based on the most recent Mortgage that was taken out on this home.
Original Mortgage
$122,735
Interest Rate
3.83%
Purchase Details
Closed on
Feb 1, 2005
Sold by
Martin David J
Bought by
Manley Assoc
Purchase Details
Closed on
Dec 22, 1999
Sold by
Buckley Margaret B
Bought by
Martin Daniel J
Purchase Details
Closed on
Jun 4, 1999
Sold by
Emc Mtg Corp
Bought by
Buckley Magaret B
Create a Home Valuation Report for This Property
The Home Valuation Report is an in-depth analysis detailing your home's value as well as a comparison with similar homes in the area
Home Values in the Area
Average Home Value in this Area
Purchase History
| Date | Buyer | Sale Price | Title Company |
|---|---|---|---|
| Krupienski Timothy R | $140,000 | None Available | |
| Krupienski Timothy R | $140,000 | None Available | |
| Krupienski Jonathan E | $125,000 | -- | |
| Krupienski Jonathan E | $125,000 | -- | |
| Krupienski Jonathan E | $125,000 | -- | |
| Manley Assoc | $157,000 | -- | |
| Manley Assoc | $157,000 | -- | |
| Martin Daniel J | $58,500 | -- | |
| Martin Daniel J | $58,500 | -- | |
| Buckley Magaret B | $54,900 | -- | |
| Buckley Magaret B | $54,900 | -- |
Source: Public Records
Mortgage History
| Date | Status | Borrower | Loan Amount |
|---|---|---|---|
| Previous Owner | Krupienski Jonathan E | $122,735 |
Source: Public Records
Tax History Compared to Growth
Tax History
| Year | Tax Paid | Tax Assessment Tax Assessment Total Assessment is a certain percentage of the fair market value that is determined by local assessors to be the total taxable value of land and additions on the property. | Land | Improvement |
|---|---|---|---|---|
| 2025 | $3,298 | $111,620 | $0 | $111,620 |
| 2024 | $3,253 | $111,620 | $0 | $111,620 |
| 2023 | $3,033 | $111,620 | $0 | $111,620 |
| 2022 | $2,975 | $111,620 | $0 | $111,620 |
| 2021 | $2,381 | $86,100 | $0 | $86,100 |
| 2020 | $2,383 | $86,100 | $0 | $86,100 |
| 2019 | $2,471 | $86,100 | $0 | $86,100 |
| 2018 | $2,388 | $86,100 | $0 | $86,100 |
| 2017 | $2,393 | $86,100 | $0 | $86,100 |
| 2016 | $2,518 | $90,430 | $0 | $90,430 |
| 2015 | $2,521 | $90,430 | $0 | $90,430 |
| 2014 | $2,462 | $90,430 | $0 | $90,430 |
Source: Public Records
Map
Nearby Homes
- 157 Kings Hwy Unit E
- 152 Beach Ave
- 25 Village Rd
- 207 Merwin Ave
- 30 Salem Walk
- 49 Merwin Ave Unit 49
- 40 Hawley Ave
- 32 Wall St
- 15 Greenwich Way
- 64 Greenwich Way
- 10 Sperry St
- 29 Meetinghouse Ln
- 6 Howe St
- 26 Riverdale Rd
- 18 Riverdale Rd
- 29 Anderson Ave
- 1120 New Haven Ave Unit 148
- 1080 New Haven Ave Unit 113
- 36 Kenwood Rd
- 32 Burwell Ave
- 157 1/2 Kings Hwy Unit P
- 157 1/2 Kings Hwy Unit O
- 157 1/2 Kings Hwy Unit N
- 157 1/2 Kings Hwy Unit M
- 157 1/2 Kings Hwy Unit L
- 157 1/2 Kings Hwy Unit K
- 157 1/2 Kings Hwy Unit J
- 157 1/2 Kings Hwy Unit I
- 157 1/2 Kings Hwy Unit H
- 157 1/2 Kings Hwy Unit G
- 157 1/2 Kings Hwy Unit F
- 157 1/2 Kings Hwy Unit D
- 157 1/2 Kings Hwy Unit C
- 157 1/2 Kings Hwy Unit B
- 116 Hawley Ave
- 157 Kings Hwy
- 157 Kings Hwy Unit K
- 157 Kings Hwy Unit F
- 157 Kings Hwy - 157 1 2 Unit E