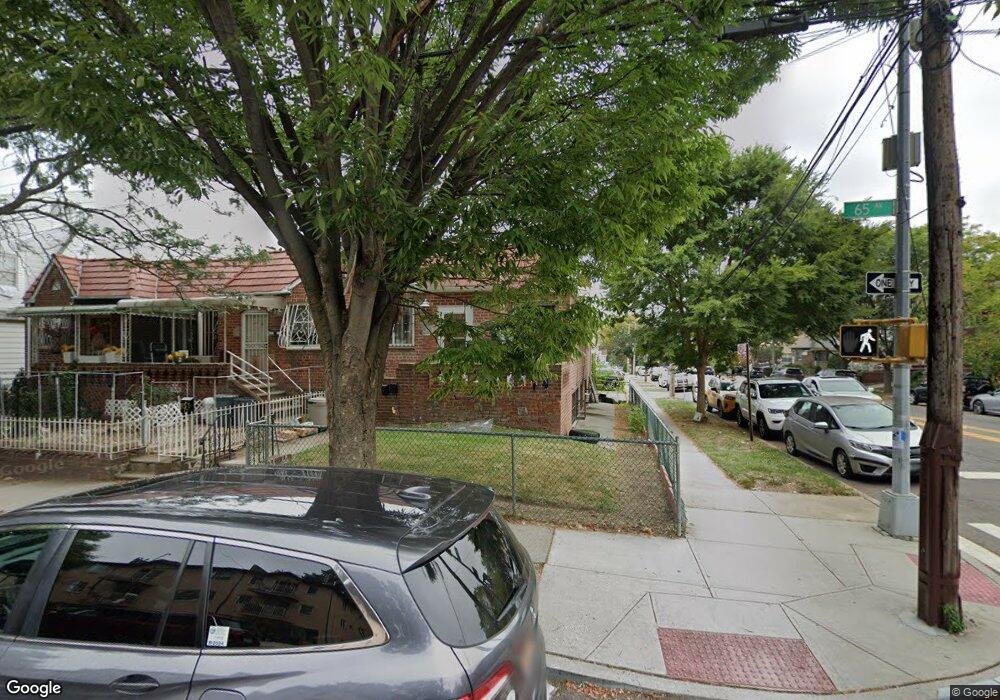
157-19 65th Ave Unit 1 Flushing, NY 11367
Pomonok NeighborhoodEstimated Value: $947,695 - $1,098,000
2
Beds
1
Bath
1,657
Sq Ft
$628/Sq Ft
Est. Value
About This Home
This home is located at 157-19 65th Ave Unit 1, Flushing, NY 11367 and is currently estimated at $1,041,424, approximately $628 per square foot. 157-19 65th Ave Unit 1 is a home located in Queens County with nearby schools including P.S. 201 - The Discovery School for Inquiry & Research and Rachel Carson I.S. 237Q.
Ownership History
Date
Name
Owned For
Owner Type
Purchase Details
Closed on
Feb 15, 2012
Sold by
Chen Bei
Bought by
R & B Realty Management Llc
Current Estimated Value
Purchase Details
Closed on
Jun 5, 2009
Sold by
Quickfoot Realty Llc
Bought by
Chen Bei
Purchase Details
Closed on
Apr 6, 2009
Sold by
Gianturco Esq Referee Diana C
Bought by
Quickfoot Realty Llc
Purchase Details
Closed on
Apr 21, 2005
Sold by
Gary I Kahn
Bought by
Tserpelis George
Home Financials for this Owner
Home Financials are based on the most recent Mortgage that was taken out on this home.
Original Mortgage
$266,250
Interest Rate
6.01%
Mortgage Type
Purchase Money Mortgage
Purchase Details
Closed on
Sep 7, 2004
Sold by
Freedner Herbert
Bought by
Kahn Gary I and Katz Jeffrey
Create a Home Valuation Report for This Property
The Home Valuation Report is an in-depth analysis detailing your home's value as well as a comparison with similar homes in the area
Home Values in the Area
Average Home Value in this Area
Purchase History
| Date | Buyer | Sale Price | Title Company |
|---|---|---|---|
| R & B Realty Management Llc | -- | -- | |
| Chen Bei | $505,000 | -- | |
| Quickfoot Realty Llc | $335,000 | -- | |
| Tserpelis George | $355,000 | -- | |
| Kahn Gary I | $262,500 | -- |
Source: Public Records
Mortgage History
| Date | Status | Borrower | Loan Amount |
|---|---|---|---|
| Previous Owner | Tserpelis George | $266,250 |
Source: Public Records
Tax History
| Year | Tax Paid | Tax Assessment Tax Assessment Total Assessment is a certain percentage of the fair market value that is determined by local assessors to be the total taxable value of land and additions on the property. | Land | Improvement |
|---|---|---|---|---|
| 2025 | $8,101 | $40,643 | $7,594 | $33,049 |
| 2024 | $8,102 | $40,336 | $7,502 | $32,834 |
| 2023 | $7,643 | $38,053 | $5,973 | $32,080 |
| 2022 | $5,375 | $57,240 | $9,720 | $47,520 |
| 2021 | $7,128 | $59,940 | $9,720 | $50,220 |
| 2020 | $7,169 | $58,980 | $9,720 | $49,260 |
| 2019 | $7,032 | $52,200 | $9,720 | $42,480 |
| 2018 | $6,464 | $31,711 | $7,577 | $24,134 |
| 2017 | $6,099 | $29,917 | $6,769 | $23,148 |
| 2016 | $5,642 | $29,917 | $6,769 | $23,148 |
| 2015 | $2,269 | $28,224 | $7,341 | $20,883 |
| 2014 | $2,269 | $28,011 | $7,733 | $20,278 |
Source: Public Records
Map
Nearby Homes
- 6143 157th St
- 155-17 65th Ave
- 6113 156th St
- 6111 156th St
- 6126 160th St
- 154-28 65th Ave
- 61-12 160th St
- 5944 159th St
- 6116 161st St
- 59-41 156th St
- 159-08 59th Ave
- 15272 Melbourne Ave Unit 2G
- 153-51 Horace Harding Expy
- 59-09 Kissena Blvd
- 152-56 Melbourne Ave Unit 246A
- 69-28 Kissena Blvd Unit 130B
- 59-32 164th St
- 152-10 Melbourne Ave Unit 223A
- 152-63 Jewel Ave Unit 1FL
- 61-17 165th St
- 157-19 65th Ave Unit 1st FL
- 15719 65th Ave
- 15717 65th Ave
- 15717 65th Ave
- 15715 65th Ave
- 61-42 Parsons Blvd
- 15711 65th Ave
- 6142 Parsons Blvd
- 6149 Parsons Blvd
- 15709 65th Ave
- 6140 Parsons Blvd
- 6140 Parsons Blvd
- 6145 Parsons Blvd Unit 2
- 6145 Parsons Blvd
- 61-45 Parsons Blvd
- 61-45 Parsons Blvd Unit 2
- 61-45 Parsons Blvd Unit 1 FL
- 157-07 65th Ave
- 15707 65th Ave
- 6136 Parsons Blvd
Your Personal Tour Guide
Ask me questions while you tour the home.