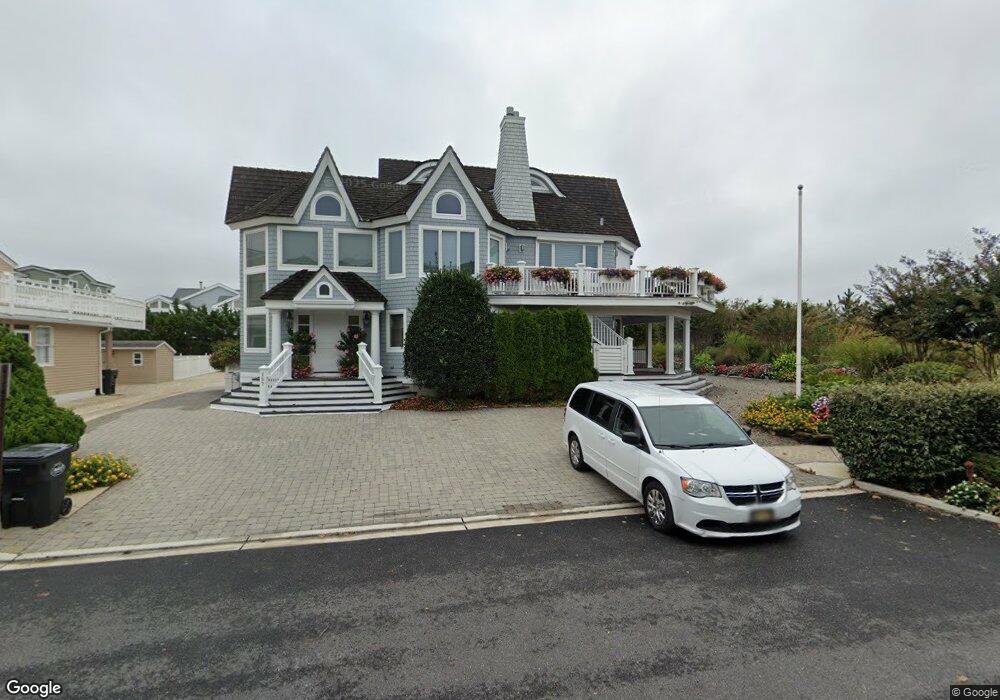
157 59th St Avalon, NJ 08202
Estimated Value: $6,521,000 - $8,075,000
--
Bed
--
Bath
5,195
Sq Ft
$1,400/Sq Ft
Est. Value
About This Home
This home is located at 157 59th St, Avalon, NJ 08202 and is currently estimated at $7,272,859, approximately $1,399 per square foot. 157 59th St is a home located in Cape May County with nearby schools including Avalon Elementary School.
Ownership History
Date
Name
Owned For
Owner Type
Purchase Details
Closed on
Jan 22, 2025
Sold by
Polett Margo B
Bought by
Margo B Polett 2025 Revocable Trust and Polett
Current Estimated Value
Purchase Details
Closed on
Jul 10, 2017
Sold by
Polett Margo B
Bought by
Polett Margo B and Polett Daniel H
Purchase Details
Closed on
Dec 17, 2012
Sold by
Polett Daniel H
Bought by
Polett Daniel H and Polett Margo B
Purchase Details
Closed on
Mar 16, 1989
Sold by
Polett Daniel and Polett Margo
Bought by
Atlantic City Electric Co
Create a Home Valuation Report for This Property
The Home Valuation Report is an in-depth analysis detailing your home's value as well as a comparison with similar homes in the area
Home Values in the Area
Average Home Value in this Area
Purchase History
| Date | Buyer | Sale Price | Title Company |
|---|---|---|---|
| Margo B Polett 2025 Revocable Trust | -- | First American Title Insurance | |
| Margo B Polett 2025 Revocable Trust | -- | First American Title Insurance | |
| Polett Margo B | -- | First American Title Insurance | |
| Polett Margo B | -- | First American Title Insurance | |
| Polett Margo B | -- | None Available | |
| Polett Daniel H | -- | None Available | |
| Atlantic City Electric Co | -- | -- |
Source: Public Records
Tax History Compared to Growth
Tax History
| Year | Tax Paid | Tax Assessment Tax Assessment Total Assessment is a certain percentage of the fair market value that is determined by local assessors to be the total taxable value of land and additions on the property. | Land | Improvement |
|---|---|---|---|---|
| 2025 | $58,183 | $9,476,100 | $7,425,000 | $2,051,100 |
| 2024 | $58,183 | $9,476,100 | $7,425,000 | $2,051,100 |
| 2023 | $57,709 | $9,476,100 | $7,425,000 | $2,051,100 |
| 2022 | $53,824 | $9,476,100 | $7,425,000 | $2,051,100 |
| 2021 | $36,246 | $9,476,100 | $7,425,000 | $2,051,100 |
| 2020 | $49,844 | $9,476,100 | $7,425,000 | $2,051,100 |
| 2019 | $48,328 | $9,476,100 | $7,425,000 | $2,051,100 |
| 2018 | $46,243 | $9,476,100 | $7,425,000 | $2,051,100 |
| 2017 | $43,871 | $7,890,500 | $5,670,000 | $2,220,500 |
| 2016 | $43,398 | $7,890,500 | $5,670,000 | $2,220,500 |
| 2015 | $42,688 | $7,890,500 | $5,670,000 | $2,220,500 |
| 2014 | $42,214 | $7,890,500 | $5,670,000 | $2,220,500 |
Source: Public Records
Map
Nearby Homes
- 245 57th St
- 5765 Ocean Dr
- 5499 Dune Dr
- 6229 Dune Dr
- 150 64th St
- 6762 Ocean Dr Unit 6762
- 6772 Ocean Dr Unit 6772
- 4640 Ocean Dr
- 4610 4th Ave
- 7463 Ocean Dr
- 264 41st St
- 22 Pelican Dr S
- 304 78th St Unit East
- 74 38th St
- 7888 Dune Dr Unit 218
- 315 79th St Unit 315
- 280 79th St Unit 2
- 280 79th St Unit 1
- 7929 Dune Dr Unit 212
- 301 80th St Unit B24