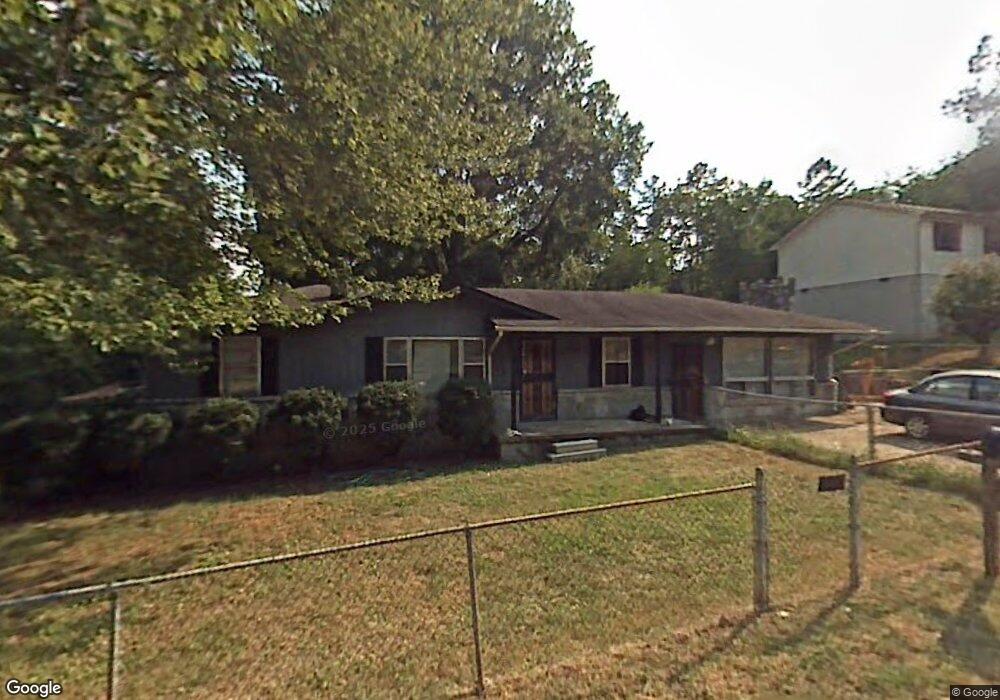
157 6th St Rossville, GA 30741
Estimated Value: $225,377 - $314,000
--
Bed
2
Baths
1,764
Sq Ft
$148/Sq Ft
Est. Value
About This Home
This home is located at 157 6th St, Rossville, GA 30741 and is currently estimated at $260,594, approximately $147 per square foot. 157 6th St is a home located in Walker County with nearby schools including Stone Creek Elementary School, Rossville Middle School, and Ridgeland High School.
Ownership History
Date
Name
Owned For
Owner Type
Purchase Details
Closed on
Apr 18, 2007
Sold by
Bank & Trust New York
Bought by
Young Sandra
Current Estimated Value
Home Financials for this Owner
Home Financials are based on the most recent Mortgage that was taken out on this home.
Original Mortgage
$47,120
Outstanding Balance
$28,412
Interest Rate
6.1%
Mortgage Type
New Conventional
Estimated Equity
$232,182
Purchase Details
Closed on
Jan 2, 2007
Sold by
Not Provided
Bought by
Young Sandra
Purchase Details
Closed on
May 16, 2000
Sold by
Northwest Mortgage Inc
Bought by
Fletcher Kenneth C
Purchase Details
Closed on
Sep 7, 1999
Sold by
Burse Casey L
Bought by
Secretary Of Housing & Urban
Purchase Details
Closed on
Oct 18, 1996
Sold by
Buchanan Robert Donald
Bought by
Burse Casey L
Purchase Details
Closed on
Nov 22, 1972
Sold by
Harris Ben
Bought by
Buchanan Robert Donald
Purchase Details
Closed on
Jan 1, 1972
Bought by
Harris Ben
Create a Home Valuation Report for This Property
The Home Valuation Report is an in-depth analysis detailing your home's value as well as a comparison with similar homes in the area
Home Values in the Area
Average Home Value in this Area
Purchase History
| Date | Buyer | Sale Price | Title Company |
|---|---|---|---|
| Young Sandra | $58,000 | -- | |
| Young Sandra | -- | -- | |
| Fletcher Kenneth C | $65,000 | -- | |
| Secretary Of Housing & Urban | -- | -- | |
| Northwest Mortgage Inc | -- | -- | |
| Burse Casey L | $65,000 | -- | |
| Buchanan Robert Donald | $14,000 | -- | |
| Harris Ben | -- | -- |
Source: Public Records
Mortgage History
| Date | Status | Borrower | Loan Amount |
|---|---|---|---|
| Open | Young Sandra | $47,120 |
Source: Public Records
Tax History Compared to Growth
Tax History
| Year | Tax Paid | Tax Assessment Tax Assessment Total Assessment is a certain percentage of the fair market value that is determined by local assessors to be the total taxable value of land and additions on the property. | Land | Improvement |
|---|---|---|---|---|
| 2024 | $1,520 | $64,698 | $1,200 | $63,498 |
| 2023 | $1,481 | $61,557 | $1,200 | $60,357 |
| 2022 | $1,363 | $53,109 | $1,200 | $51,909 |
| 2021 | $1,215 | $42,402 | $1,200 | $41,202 |
| 2020 | $1,047 | $34,632 | $1,200 | $33,432 |
| 2019 | $1,064 | $34,632 | $1,200 | $33,432 |
| 2018 | $971 | $36,711 | $1,200 | $35,511 |
| 2017 | $1,235 | $37,111 | $1,600 | $35,511 |
| 2016 | $989 | $37,111 | $1,600 | $35,511 |
| 2015 | $935 | $32,902 | $1,600 | $31,302 |
| 2014 | $895 | $32,902 | $1,600 | $31,302 |
| 2013 | -- | $32,901 | $1,600 | $31,301 |
Source: Public Records
Map
Nearby Homes