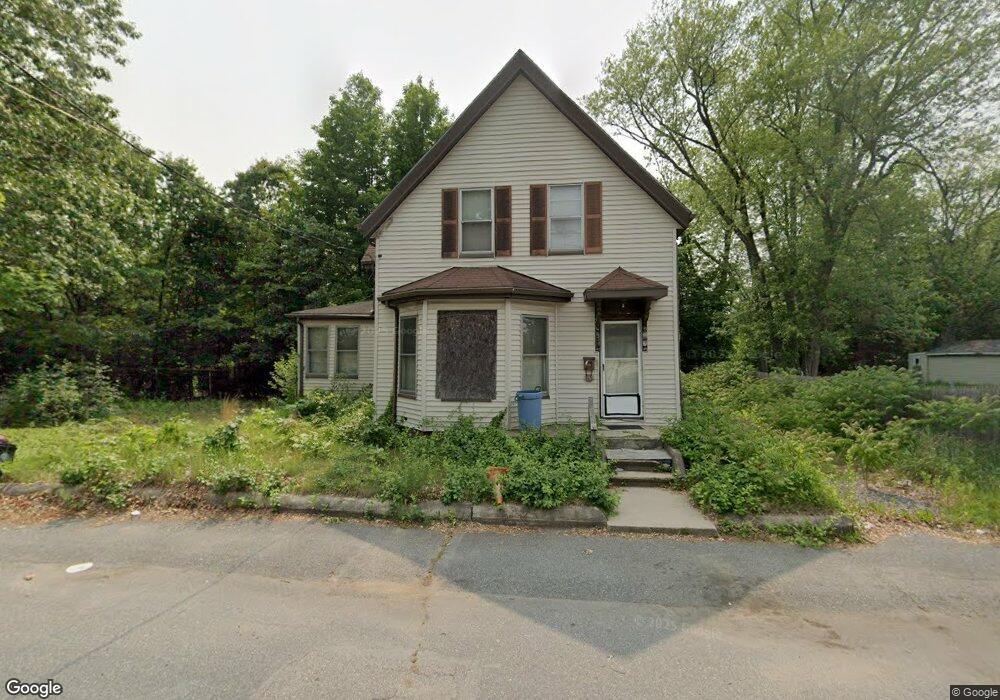
157 Forest St Brockton, MA 02302
Campello NeighborhoodEstimated Value: $384,000 - $462,000
4
Beds
1
Bath
1,298
Sq Ft
$327/Sq Ft
Est. Value
About This Home
This home is located at 157 Forest St, Brockton, MA 02302 and is currently estimated at $424,793, approximately $327 per square foot. 157 Forest St is a home located in Plymouth County with nearby schools including Gilmore Elementary School, Davis K-8 School, and John F. Kennedy Elementary School.
Ownership History
Date
Name
Owned For
Owner Type
Purchase Details
Closed on
Aug 1, 1997
Sold by
Tripolone Elizabeth
Bought by
Lazarte Virginia and Lazarte Juan
Current Estimated Value
Home Financials for this Owner
Home Financials are based on the most recent Mortgage that was taken out on this home.
Original Mortgage
$55,200
Interest Rate
7.55%
Mortgage Type
Purchase Money Mortgage
Create a Home Valuation Report for This Property
The Home Valuation Report is an in-depth analysis detailing your home's value as well as a comparison with similar homes in the area
Home Values in the Area
Average Home Value in this Area
Purchase History
| Date | Buyer | Sale Price | Title Company |
|---|---|---|---|
| Lazarte Virginia | $69,000 | -- |
Source: Public Records
Mortgage History
| Date | Status | Borrower | Loan Amount |
|---|---|---|---|
| Open | Lazarte Virginia | $116,100 | |
| Closed | Lazarte Virginia | $83,000 | |
| Closed | Lazarte Virginia | $55,200 |
Source: Public Records
Tax History
| Year | Tax Paid | Tax Assessment Tax Assessment Total Assessment is a certain percentage of the fair market value that is determined by local assessors to be the total taxable value of land and additions on the property. | Land | Improvement |
|---|---|---|---|---|
| 2025 | $4,196 | $346,500 | $140,700 | $205,800 |
| 2024 | $4,058 | $337,600 | $140,700 | $196,900 |
| 2023 | $3,910 | $301,200 | $107,500 | $193,700 |
| 2022 | $3,784 | $270,900 | $97,800 | $173,100 |
| 2021 | $24,199 | $237,200 | $81,900 | $155,300 |
| 2020 | $3,365 | $222,100 | $76,100 | $146,000 |
| 2019 | $21,684 | $209,400 | $74,000 | $135,400 |
| 2018 | $21,937 | $179,500 | $74,000 | $105,500 |
| 2017 | $2,536 | $157,500 | $74,000 | $83,500 |
| 2016 | $2,446 | $140,900 | $71,900 | $69,000 |
| 2015 | $2,062 | $113,600 | $71,900 | $41,700 |
| 2014 | $2,130 | $117,500 | $71,900 | $45,600 |
Source: Public Records
Map
Nearby Homes
- 41 Riverview St
- 223 Clinton St Unit 16
- 15 Market St
- 549 Summer St
- 35 Longworth Ave Unit 25
- 23 E Chestnut St
- 111 Riverview St
- 26 South St
- 25 Longworth Ave Unit 4
- 24 E Chestnut St
- 34 South St
- 15 Longworth Ave Unit 226
- 9 Longworth Ave Unit 135
- 9 Longworth Ave Unit 113
- 100 Concord St
- 25 Tremont St
- 60 Tremont St
- 115 Market St
- 12 Paulin Ave
- 65 Tremont St
Your Personal Tour Guide
Ask me questions while you tour the home.