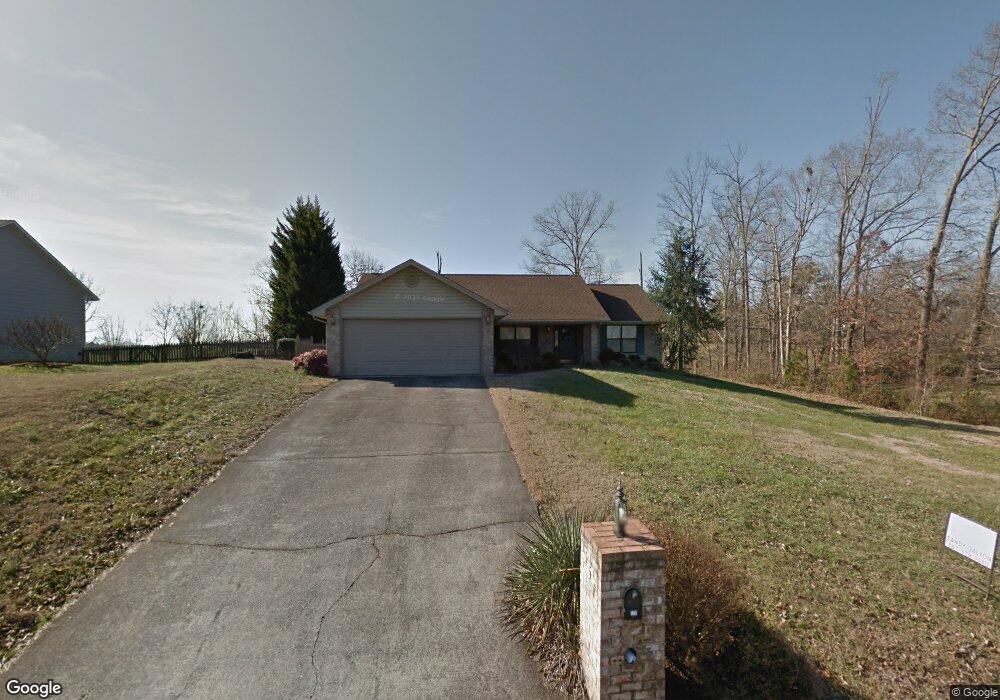
157 Maple Ridge Ln Seymour, TN 37865
Estimated Value: $391,090 - $428,000
3
Beds
2
Baths
1,778
Sq Ft
$230/Sq Ft
Est. Value
About This Home
This home is located at 157 Maple Ridge Ln, Seymour, TN 37865 and is currently estimated at $409,545, approximately $230 per square foot. 157 Maple Ridge Ln is a home located in Sevier County with nearby schools including Northview Elementary School, Catons Chapel Elementary School, and Jones Cove Elementary School.
Ownership History
Date
Name
Owned For
Owner Type
Purchase Details
Closed on
Jul 5, 2018
Sold by
Gray Jason C and Gray Christina Y
Bought by
Bohanan Robin Ann
Current Estimated Value
Purchase Details
Closed on
Jan 29, 2016
Sold by
Bohanan Larry G
Bought by
Gray Jason C and Gray Christina Y
Home Financials for this Owner
Home Financials are based on the most recent Mortgage that was taken out on this home.
Original Mortgage
$144,000
Interest Rate
4.04%
Mortgage Type
New Conventional
Purchase Details
Closed on
Jun 8, 2000
Sold by
Webb Jimmy C
Bought by
Bohanan Larry G
Purchase Details
Closed on
May 14, 1999
Sold by
Etal Mccarter David
Bought by
Webb Jimmy C
Purchase Details
Closed on
Mar 14, 1995
Sold by
Chad Dixon
Bought by
Mccarter David E
Purchase Details
Closed on
Jun 20, 1994
Sold by
Boling Kenneth O
Bought by
Chad Dixon
Purchase Details
Closed on
Jun 17, 1994
Bought by
Dixon Chad and Dixon Shannon
Create a Home Valuation Report for This Property
The Home Valuation Report is an in-depth analysis detailing your home's value as well as a comparison with similar homes in the area
Home Values in the Area
Average Home Value in this Area
Purchase History
| Date | Buyer | Sale Price | Title Company |
|---|---|---|---|
| Bohanan Robin Ann | -- | None Available | |
| Gray Jason C | $180,000 | -- | |
| Bohanan Larry G | $136,000 | -- | |
| Webb Jimmy C | $118,500 | -- | |
| Mccarter David E | $91,000 | -- | |
| Chad Dixon | -- | -- | |
| Dixon Chad | $14,300 | -- |
Source: Public Records
Mortgage History
| Date | Status | Borrower | Loan Amount |
|---|---|---|---|
| Previous Owner | Gray Jason C | $144,000 |
Source: Public Records
Tax History Compared to Growth
Tax History
| Year | Tax Paid | Tax Assessment Tax Assessment Total Assessment is a certain percentage of the fair market value that is determined by local assessors to be the total taxable value of land and additions on the property. | Land | Improvement |
|---|---|---|---|---|
| 2025 | $833 | $56,275 | $8,750 | $47,525 |
| 2024 | $833 | $56,275 | $8,750 | $47,525 |
| 2023 | $833 | $56,275 | $0 | $0 |
| 2022 | $833 | $56,275 | $8,750 | $47,525 |
| 2021 | $833 | $56,275 | $8,750 | $47,525 |
| 2020 | $831 | $56,275 | $8,750 | $47,525 |
| 2019 | $831 | $44,675 | $8,750 | $35,925 |
| 2018 | $831 | $44,675 | $8,750 | $35,925 |
| 2017 | $831 | $44,675 | $8,750 | $35,925 |
| 2016 | $831 | $44,675 | $8,750 | $35,925 |
| 2015 | -- | $46,175 | $0 | $0 |
| 2014 | $753 | $46,181 | $0 | $0 |
Source: Public Records
Map
Nearby Homes
- 225 Golden Rod Dr
- 112 Golden Rod Dr
- 107 Sunflower Loop
- 153 Ailey Cir
- 0 Illinois Ave Unit 1299088
- 2329 Louisiana Ct
- 0 Louisiana Ct Unit 1315183
- 427 Montana Ct
- 207 Fallen Oak Cir
- 1319 Boyds Creek Hwy
- 336 Illinois Ave
- 107 van Gilder Way
- 105 van Gilder Way
- 103 van Gilder Way
- 279 Mississippi Ave
- 160 Mississippi Ave
- 562 Illinois Ave
- 1161 Boyds Creek Hwy
- 1145 Creekside Village Way
- 1077 Creekside Village Way
- 161 Maple Ridge Ln
- 153 Maple Ridge Ln
- 158 Maple Ridge Ln
- 154 Maple Ridge Ln
- 165 Maple Ridge Ln
- 149 Maple Ridge Ln
- 150 Maple Ridge Ln
- 166 Maple Ridge Ln
- 169 Maple Ridge Ln
- 208 Goldenrod Dr
- 146 Maple Ridge Ln
- 204 Goldenrod Dr
- 204 Golden Rod Dr
- 170 Maple Ridge Ln
- 210 Goldenrod Dr
- 143 Maple Ridge Ln
- 173 Maple Ridge Ln
- 202 Goldenrod Dr
- 142 Maple Ridge Ln
- 203 Golden Rod Dr