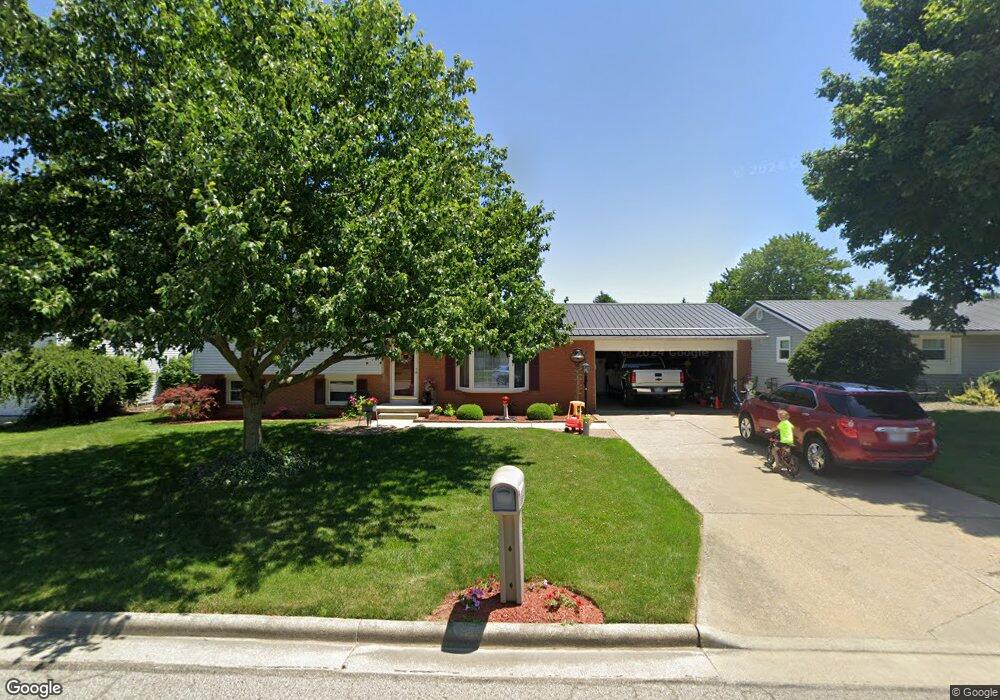
157 Poplar Ave Shelby, OH 44875
Estimated Value: $167,000 - $194,000
4
Beds
2
Baths
1,672
Sq Ft
$109/Sq Ft
Est. Value
About This Home
This home is located at 157 Poplar Ave, Shelby, OH 44875 and is currently estimated at $182,574, approximately $109 per square foot. 157 Poplar Ave is a home located in Richland County with nearby schools including St. Mary's School.
Ownership History
Date
Name
Owned For
Owner Type
Purchase Details
Closed on
Apr 15, 2009
Sold by
Steele Karen M and Steele Charles L
Bought by
Steele Karen M and Steele Charles L
Current Estimated Value
Purchase Details
Closed on
Jan 25, 1996
Sold by
Edgell John E
Bought by
Steele Charles L and Steele Karen M
Home Financials for this Owner
Home Financials are based on the most recent Mortgage that was taken out on this home.
Original Mortgage
$74,000
Interest Rate
7.19%
Mortgage Type
New Conventional
Purchase Details
Closed on
May 13, 1994
Sold by
Barber Howard L
Bought by
Edgell John B
Create a Home Valuation Report for This Property
The Home Valuation Report is an in-depth analysis detailing your home's value as well as a comparison with similar homes in the area
Home Values in the Area
Average Home Value in this Area
Purchase History
| Date | Buyer | Sale Price | Title Company |
|---|---|---|---|
| Steele Karen M | -- | None Available | |
| Steele Karen M | -- | None Available | |
| Steele Charles L | $92,500 | -- | |
| Edgell John B | $86,000 | -- |
Source: Public Records
Mortgage History
| Date | Status | Borrower | Loan Amount |
|---|---|---|---|
| Previous Owner | Steele Charles L | $74,000 |
Source: Public Records
Tax History Compared to Growth
Tax History
| Year | Tax Paid | Tax Assessment Tax Assessment Total Assessment is a certain percentage of the fair market value that is determined by local assessors to be the total taxable value of land and additions on the property. | Land | Improvement |
|---|---|---|---|---|
| 2024 | $1,832 | $47,960 | $7,170 | $40,790 |
| 2023 | $1,832 | $47,960 | $7,170 | $40,790 |
| 2022 | $1,725 | $40,390 | $6,990 | $33,400 |
| 2021 | $1,726 | $40,390 | $6,990 | $33,400 |
| 2020 | $1,727 | $40,390 | $6,990 | $33,400 |
| 2019 | $1,582 | $33,940 | $5,870 | $28,070 |
| 2018 | $1,567 | $33,940 | $5,870 | $28,070 |
| 2017 | $1,580 | $33,940 | $5,870 | $28,070 |
| 2016 | $1,608 | $35,390 | $5,700 | $29,690 |
| 2015 | $1,599 | $35,390 | $5,700 | $29,690 |
| 2014 | $1,545 | $35,390 | $5,700 | $29,690 |
| 2012 | $760 | $35,380 | $5,870 | $29,510 |
Source: Public Records
Map
Nearby Homes