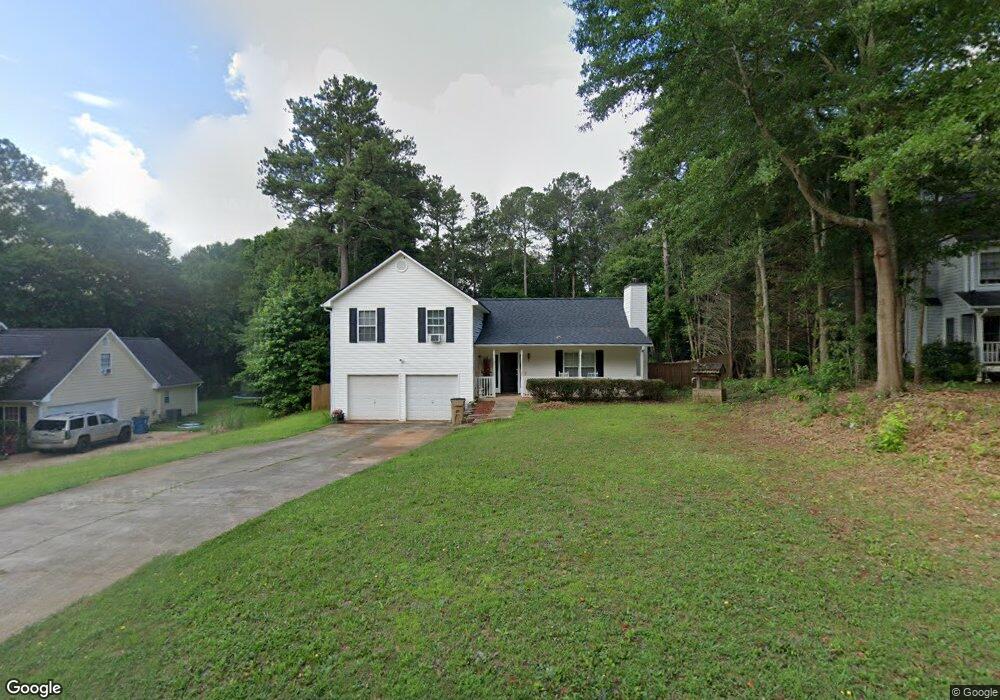
157 Regency Dr Bethlehem, GA 30620
Estimated Value: $301,889 - $333,000
4
Beds
3
Baths
1,472
Sq Ft
$215/Sq Ft
Est. Value
About This Home
This home is located at 157 Regency Dr, Bethlehem, GA 30620 and is currently estimated at $315,972, approximately $214 per square foot. 157 Regency Dr is a home located in Barrow County with nearby schools including Bethlehem Elementary School, Haymon-Morris Middle School, and Apalachee High School.
Ownership History
Date
Name
Owned For
Owner Type
Purchase Details
Closed on
May 11, 2020
Sold by
Whitmore Christopher M
Bought by
Whitmore Amelia D
Current Estimated Value
Purchase Details
Closed on
Aug 8, 2006
Sold by
Whitmore Christopher
Bought by
Whitmore Christopher M Aka
Purchase Details
Closed on
Feb 8, 2000
Sold by
Design Dimensions Inc
Bought by
Whitmore Christopher M and Whitmore Amelia D
Home Financials for this Owner
Home Financials are based on the most recent Mortgage that was taken out on this home.
Original Mortgage
$98,050
Interest Rate
8.11%
Mortgage Type
FHA
Purchase Details
Closed on
Nov 25, 1998
Sold by
Developme Dun La Hur
Bought by
Design Dimensions In
Purchase Details
Closed on
Mar 8, 1996
Bought by
Developme Dun La Hur
Create a Home Valuation Report for This Property
The Home Valuation Report is an in-depth analysis detailing your home's value as well as a comparison with similar homes in the area
Home Values in the Area
Average Home Value in this Area
Purchase History
| Date | Buyer | Sale Price | Title Company |
|---|---|---|---|
| Whitmore Amelia D | -- | -- | |
| Whitmore Christopher M Aka | -- | -- | |
| Whitmore Christopher M | $106,600 | -- | |
| Design Dimensions In | $32,000 | -- | |
| Developme Dun La Hur | -- | -- |
Source: Public Records
Mortgage History
| Date | Status | Borrower | Loan Amount |
|---|---|---|---|
| Previous Owner | Whitmore Christopher M | $98,050 |
Source: Public Records
Tax History Compared to Growth
Tax History
| Year | Tax Paid | Tax Assessment Tax Assessment Total Assessment is a certain percentage of the fair market value that is determined by local assessors to be the total taxable value of land and additions on the property. | Land | Improvement |
|---|---|---|---|---|
| 2024 | $2,202 | $99,431 | $25,000 | $74,431 |
| 2023 | $1,790 | $99,831 | $25,000 | $74,831 |
| 2022 | $2,002 | $76,838 | $16,000 | $60,838 |
| 2021 | $1,783 | $63,618 | $16,000 | $47,618 |
| 2020 | $1,778 | $63,618 | $16,000 | $47,618 |
| 2019 | $1,805 | $63,618 | $16,000 | $47,618 |
| 2018 | $1,482 | $50,774 | $12,600 | $38,174 |
| 2017 | $1,225 | $42,070 | $12,600 | $29,470 |
| 2016 | $1,212 | $42,412 | $12,600 | $29,812 |
| 2015 | $1,228 | $42,754 | $12,600 | $30,154 |
| 2014 | $1,049 | $36,670 | $6,174 | $30,496 |
| 2013 | -- | $34,881 | $6,174 | $28,707 |
Source: Public Records
Map
Nearby Homes
- 1408 Wyndham Way
- 0 McElhannon Rd SW Unit 10581793
- 303 Carly Ct
- 164 Manning Gin Rd
- 1050 Bethlehem Church Rd
- 1217 Cabin Bridge Rd
- 784 Manger Ave
- 0 Manger Ave E Unit 20154677
- 0 Manger Ave E Unit 20127001
- 1109 Ravenwood Dr
- 1101 Ravenwood Dr
- 1235 Dale Dr
- 449 & 455 Carl-Bethlehem Rd
- 724 Manger Ave
- 2796 Barbon Rd
- 3300 Jack Glass Rd
- 468 Grand Oaks Ave
- 3800 George Williams Rd
- 755 Harry McCarty Rd
- 898 Harrison Mill Rd
- 155 Regency Dr
- 159 Regency Dr
- 1425 Pine View Trail
- 1451 Pine View Trail
- 1405 Pine View Trail
- 1356 Pine View Trail
- 1378 Pine View Trail
- 1340 Pine View Trail
- 1396 Pine View Trail
- 1450 Pine View Trail
- 1442 Pine View Trail
- 1255 Pine View Trail
- 1235 Pine View Trail
- 1378 Pine View Trail
- 1387 Pine View Trail
- 1405 Pine View Trail
- 1356 Pine View Trail
- 1340 Pine View Trail
- 1322 Pine View Trail
- 1302 Pine View Trail