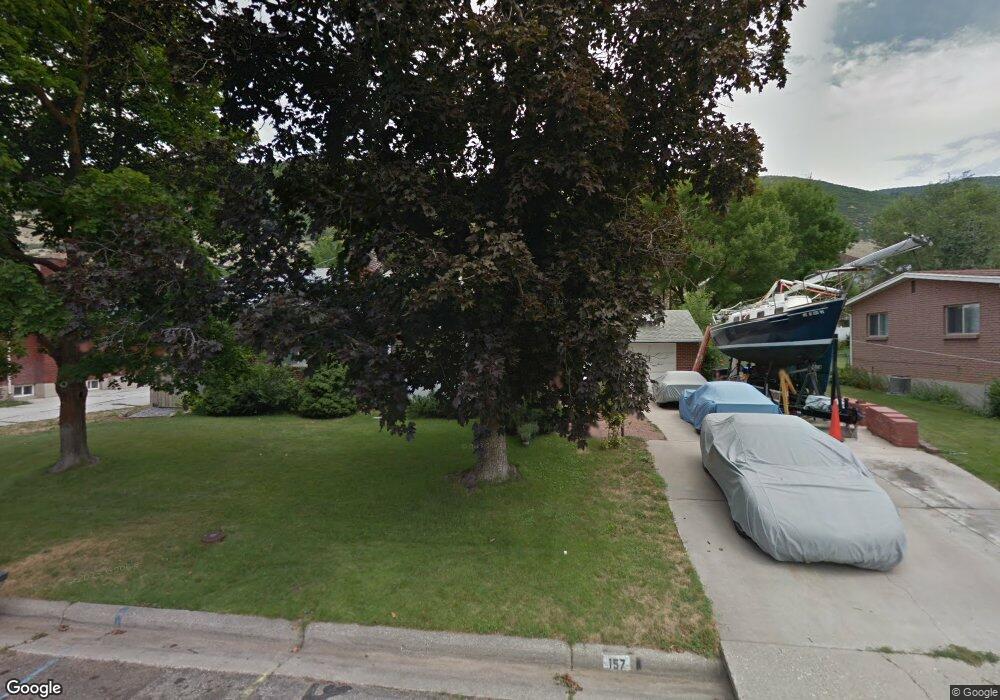
157 S 100 E Farmington, UT 84025
Estimated Value: $530,789 - $609,000
3
Beds
2
Baths
1,354
Sq Ft
$420/Sq Ft
Est. Value
About This Home
This home is located at 157 S 100 E, Farmington, UT 84025 and is currently estimated at $569,197, approximately $420 per square foot. 157 S 100 E is a home located in Davis County with nearby schools including Farmington Elementary School, Farmington High, and Farmington Junior High School.
Ownership History
Date
Name
Owned For
Owner Type
Purchase Details
Closed on
Oct 10, 2016
Sold by
Cook Steven M
Bought by
Cook Steven M and Cook Jeanne Pauline
Current Estimated Value
Purchase Details
Closed on
Feb 10, 2006
Sold by
Gregory Le Grande E
Bought by
Cook Steven M
Home Financials for this Owner
Home Financials are based on the most recent Mortgage that was taken out on this home.
Original Mortgage
$167,500
Interest Rate
6.16%
Mortgage Type
Fannie Mae Freddie Mac
Purchase Details
Closed on
Jan 26, 2006
Sold by
Mcbride Tracie
Bought by
Farmington Station Owner Assn Inc
Home Financials for this Owner
Home Financials are based on the most recent Mortgage that was taken out on this home.
Original Mortgage
$167,500
Interest Rate
6.16%
Mortgage Type
Fannie Mae Freddie Mac
Purchase Details
Closed on
May 16, 2001
Sold by
Gregory Le Grande E
Bought by
Gregory Le Grande E
Create a Home Valuation Report for This Property
The Home Valuation Report is an in-depth analysis detailing your home's value as well as a comparison with similar homes in the area
Home Values in the Area
Average Home Value in this Area
Purchase History
| Date | Buyer | Sale Price | Title Company |
|---|---|---|---|
| Cook Steven M | -- | Backman Title | |
| Cook Steven M | -- | Equity Title Ins Agency Inc | |
| Farmington Station Owner Assn Inc | -- | None Available | |
| Farmington Station Owner Assn Inc | -- | None Available | |
| Gregory Le Grande E | -- | -- |
Source: Public Records
Mortgage History
| Date | Status | Borrower | Loan Amount |
|---|---|---|---|
| Previous Owner | Cook Steven M | $167,500 |
Source: Public Records
Tax History
| Year | Tax Paid | Tax Assessment Tax Assessment Total Assessment is a certain percentage of the fair market value that is determined by local assessors to be the total taxable value of land and additions on the property. | Land | Improvement |
|---|---|---|---|---|
| 2025 | $2,611 | $257,950 | $181,299 | $76,651 |
| 2024 | $2,613 | $261,250 | $181,299 | $79,951 |
| 2023 | $2,498 | $455,000 | $219,849 | $235,151 |
| 2022 | $2,536 | $262,350 | $121,498 | $140,852 |
| 2021 | $2,350 | $362,000 | $169,459 | $192,541 |
| 2020 | $2,131 | $320,000 | $142,118 | $177,882 |
| 2019 | $2,135 | $311,000 | $142,429 | $168,571 |
| 2018 | $1,993 | $286,000 | $140,675 | $145,325 |
| 2016 | $1,774 | $131,065 | $61,245 | $69,820 |
| 2015 | $1,783 | $125,015 | $61,245 | $63,770 |
| 2014 | $1,815 | $130,777 | $51,037 | $79,740 |
| 2013 | -- | $126,963 | $45,278 | $81,685 |
Source: Public Records
Map
Nearby Homes
- 106 S 100 E
- 12 N 200 E
- 213 S 75 W
- 334 E Cottrell Ln
- 13 Sunset Dr Unit 202
- 170 N Main St
- 488 S 10 W
- 383 S 500 E
- 292 N Flag Rock Dr
- 52 N 400 W
- 2 Grayson Way N Unit 11
- 139 E 400 N
- 359 E 700 S
- 442 W Randys Ct
- 110 S Horizon Dr
- 57 W Grove Creek Cir
- 101 S Horizon Dr Unit 204
- 799 S Rice Rd
- 68 S Horizon Dr Unit 207
- 554 W Cottle Ln
- 151 S 100 E
- 165 S 100 E
- 1594 S 100 E
- 127 S 100 E
- 140 S 100 E
- 185 S 100 E
- 154 S 100 E
- 168 S 100 E
- 153 E 200 S Unit 13
- 153 E 200 S Unit 12
- 153 E 200 S Unit 11
- 153 E 200 S Unit 10
- 153 E 200 S Unit 9
- 153 E 200 S Unit 8
- 153 E 200 S Unit 7
- 153 E 200 S Unit 6
- 153 E 200 S Unit 5
- 153 E 200 S
- 153 E 200 S Unit 3
- 153 E 200 S Unit 2
Your Personal Tour Guide
Ask me questions while you tour the home.