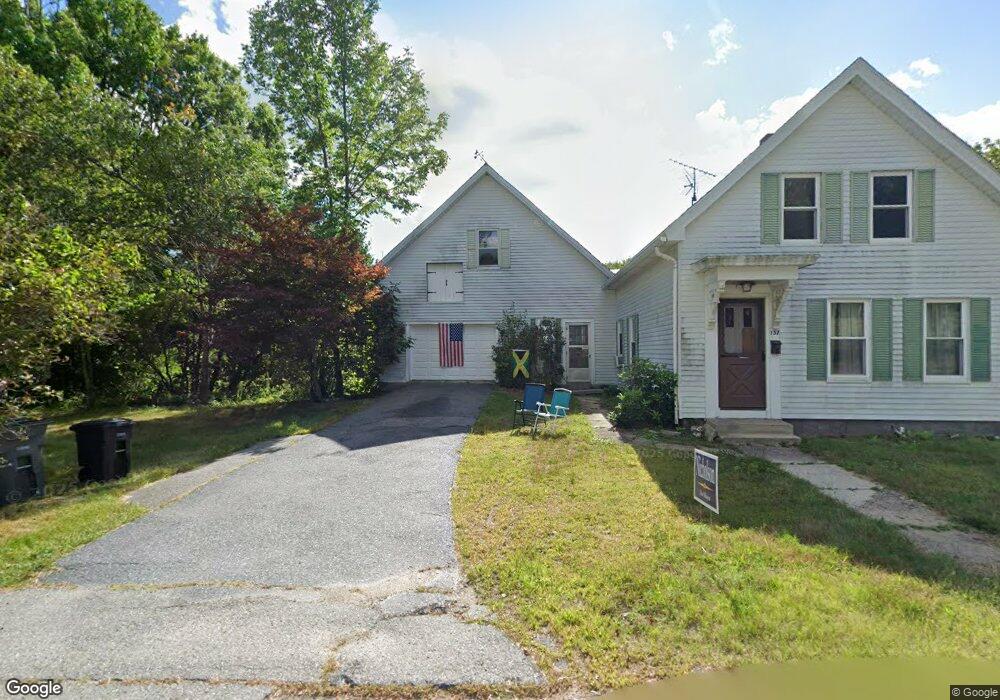
157 Temple St Gardner, MA 01440
Estimated Value: $320,000 - $369,912
3
Beds
1
Bath
1,289
Sq Ft
$267/Sq Ft
Est. Value
About This Home
This home is located at 157 Temple St, Gardner, MA 01440 and is currently estimated at $343,978, approximately $266 per square foot. 157 Temple St is a home located in Worcester County with nearby schools including Gardner High School, Holy Family Academy, and Wachusett Hills Christian School.
Ownership History
Date
Name
Owned For
Owner Type
Purchase Details
Closed on
Aug 8, 2024
Sold by
Mccarty Kathleen F
Bought by
Mccarty Kathleen F and Mccarty Brian S
Current Estimated Value
Purchase Details
Closed on
Dec 20, 2019
Sold by
Greater Gardner Community
Bought by
Gardner City Of
Purchase Details
Closed on
Jan 28, 2011
Sold by
Lowell Coop Bk
Bought by
Greater Gardner Comm D
Purchase Details
Closed on
Jul 15, 2009
Sold by
Mcmenimen Brian P and Lowell Coop Bank
Bought by
Lowell Coop Bank
Purchase Details
Closed on
Dec 27, 2004
Sold by
Mccarty Kathleen F
Bought by
Mcmenimen Brian P
Purchase Details
Closed on
Nov 24, 2004
Sold by
Mccarty Brian S and Mccarty Kathleen F
Bought by
Mccarty Kathleen F
Purchase Details
Closed on
Aug 22, 1997
Sold by
Ambrose David A and Ambrose James J
Bought by
Mccarty Brian S and Mccarty Kathleen F
Create a Home Valuation Report for This Property
The Home Valuation Report is an in-depth analysis detailing your home's value as well as a comparison with similar homes in the area
Home Values in the Area
Average Home Value in this Area
Purchase History
| Date | Buyer | Sale Price | Title Company |
|---|---|---|---|
| Mccarty Kathleen F | -- | None Available | |
| Mccarty Kathleen F | -- | None Available | |
| Gardner City Of | -- | None Available | |
| Greater Gardner Comm D | -- | -- | |
| Lowell Coop Bank | $20,000 | -- | |
| Mcmenimen Brian P | $100,000 | -- | |
| Mccarty Kathleen F | -- | -- | |
| Mccarty Brian S | $99,900 | -- | |
| Greater Gardner Comm D | -- | -- | |
| Lowell Coop Bank | $20,000 | -- | |
| Mcmenimen Brian P | $100,000 | -- | |
| Mccarty Kathleen F | -- | -- | |
| Mccarty Brian S | $99,900 | -- |
Source: Public Records
Mortgage History
| Date | Status | Borrower | Loan Amount |
|---|---|---|---|
| Previous Owner | Mccarty Brian S | $128,000 | |
| Previous Owner | Mccarty Brian S | $108,000 |
Source: Public Records
Tax History
| Year | Tax Paid | Tax Assessment Tax Assessment Total Assessment is a certain percentage of the fair market value that is determined by local assessors to be the total taxable value of land and additions on the property. | Land | Improvement |
|---|---|---|---|---|
| 2025 | $41 | $287,100 | $80,900 | $206,200 |
| 2024 | $4,128 | $275,400 | $73,600 | $201,800 |
| 2023 | $4,034 | $250,100 | $72,500 | $177,600 |
| 2022 | $3,807 | $204,800 | $54,900 | $149,900 |
| 2021 | $3,637 | $181,500 | $47,800 | $133,700 |
| 2020 | $3,502 | $177,400 | $47,800 | $129,600 |
| 2019 | $3,329 | $165,300 | $47,800 | $117,500 |
| 2018 | $3,077 | $151,800 | $47,800 | $104,000 |
| 2017 | $3,138 | $153,200 | $47,800 | $105,400 |
| 2016 | $2,915 | $142,400 | $47,800 | $94,600 |
| 2015 | $2,791 | $139,700 | $47,800 | $91,900 |
| 2014 | $2,755 | $146,000 | $55,400 | $90,600 |
Source: Public Records
Map
Nearby Homes
- 135 Temple St
- 104 Temple St
- 28 Lennon St
- 141 Bickford Hill Rd
- 100 Lawrence St
- 21 Crestwood Dr
- 196 Chestnut St
- 3 Cross St
- 0 Pearl St Unit 73213938
- 35 Cedar St Unit 6
- 212 Pearl St
- 99 Washington St
- 293 Pine St
- 52 Central St
- 205-213 Main St
- 53 Ridgewood Ln Unit 16
- 14 Travers St
- 141 Sunrise Ln
- 0 Warwick Rd
- 22 Bayberry Dr
- 157 Temple St
- 149 Temple St
- 167 Temple St
- 2 Hospital Hill Rd
- 0 Hospital Hill Rd Unit 72202239
- 170 Temple St
- 143 Temple St
- 173 Temple St
- 139 Temple St
- 146 Temple St
- 168 Temple St
- 138 Temple St
- 178 Temple St
- 106 Lennon St
- 90 Lennon St
- 127 Temple St
- 80 Lennon St
- 16 Crescent Rd
- 4 Chapman Park
- 27 Hospital Hill Rd
Your Personal Tour Guide
Ask me questions while you tour the home.