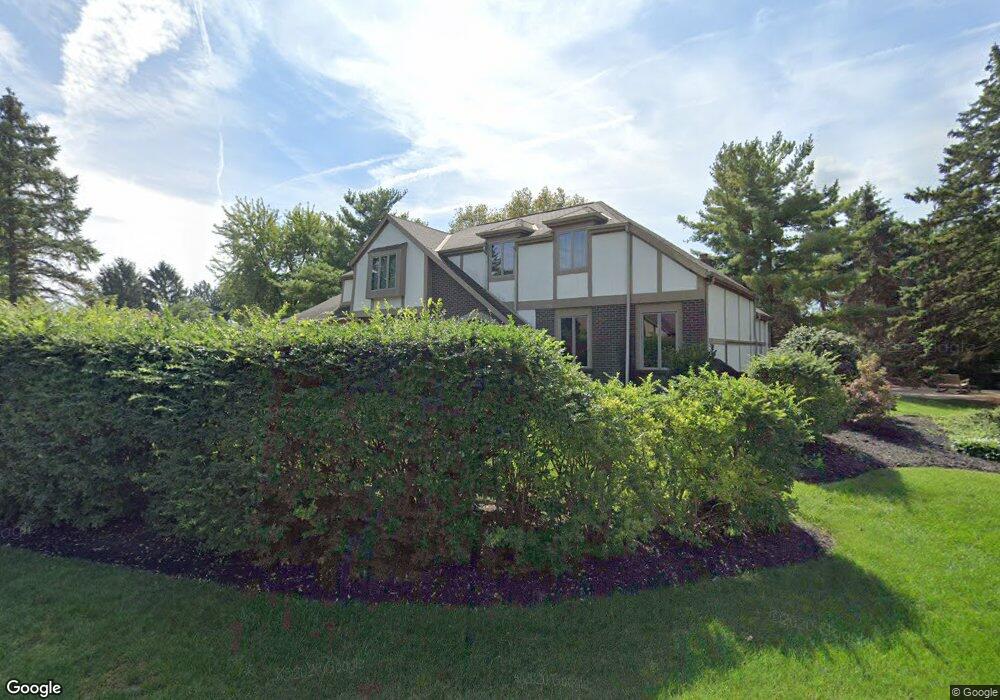
157 W Campus View Blvd Columbus, OH 43235
Woods at Josephinum NeighborhoodEstimated Value: $700,000 - $757,000
4
Beds
3
Baths
2,537
Sq Ft
$286/Sq Ft
Est. Value
About This Home
This home is located at 157 W Campus View Blvd, Columbus, OH 43235 and is currently estimated at $724,903, approximately $285 per square foot. 157 W Campus View Blvd is a home located in Franklin County with nearby schools including Worthington Hills Elementary School, McCord Middle School, and Worthington Kilbourne High School.
Ownership History
Date
Name
Owned For
Owner Type
Purchase Details
Closed on
Sep 1, 2020
Sold by
Youse David A
Bought by
Youse Kimberly S
Current Estimated Value
Purchase Details
Closed on
Mar 23, 2001
Sold by
Salyer A Roger and Salyer Candace A
Bought by
Youse David A and Youse Kimberly S
Home Financials for this Owner
Home Financials are based on the most recent Mortgage that was taken out on this home.
Original Mortgage
$244,000
Outstanding Balance
$88,914
Interest Rate
7.03%
Estimated Equity
$635,989
Purchase Details
Closed on
May 30, 1996
Sold by
Gainer James B
Bought by
Salyer A Roger and Salyer Candace A
Home Financials for this Owner
Home Financials are based on the most recent Mortgage that was taken out on this home.
Original Mortgage
$216,800
Interest Rate
6.88%
Mortgage Type
New Conventional
Purchase Details
Closed on
Nov 12, 1993
Purchase Details
Closed on
Dec 1, 1984
Create a Home Valuation Report for This Property
The Home Valuation Report is an in-depth analysis detailing your home's value as well as a comparison with similar homes in the area
Home Values in the Area
Average Home Value in this Area
Purchase History
| Date | Buyer | Sale Price | Title Company |
|---|---|---|---|
| Youse Kimberly S | -- | None Available | |
| Youse David A | $305,000 | -- | |
| Salyer A Roger | $271,000 | -- | |
| -- | $255,000 | -- | |
| -- | $170,000 | -- |
Source: Public Records
Mortgage History
| Date | Status | Borrower | Loan Amount |
|---|---|---|---|
| Open | Youse David A | $244,000 | |
| Closed | Salyer A Roger | $216,800 |
Source: Public Records
Tax History Compared to Growth
Tax History
| Year | Tax Paid | Tax Assessment Tax Assessment Total Assessment is a certain percentage of the fair market value that is determined by local assessors to be the total taxable value of land and additions on the property. | Land | Improvement |
|---|---|---|---|---|
| 2024 | $11,598 | $188,900 | $70,000 | $118,900 |
| 2023 | $11,090 | $188,895 | $70,000 | $118,895 |
| 2022 | $9,709 | $131,220 | $38,500 | $92,720 |
| 2021 | $8,957 | $131,220 | $38,500 | $92,720 |
| 2020 | $8,628 | $131,220 | $38,500 | $92,720 |
| 2019 | $8,618 | $118,270 | $35,000 | $83,270 |
| 2018 | $7,455 | $118,270 | $35,000 | $83,270 |
| 2017 | $7,141 | $118,270 | $35,000 | $83,270 |
| 2016 | $6,560 | $92,400 | $24,290 | $68,110 |
| 2015 | $6,561 | $92,400 | $24,290 | $68,110 |
| 2014 | $6,559 | $92,400 | $24,290 | $68,110 |
| 2013 | $3,263 | $92,400 | $24,290 | $68,110 |
Source: Public Records
Map
Nearby Homes
- 0 Pocono Rd Unit 225030021
- 203 Saint Pierre St
- 210 Saint Antoine St Unit 25D
- 164 Cameron Ridge Dr Unit 164
- 140 Greenglade Ave
- 67 Highland Pointe Cir Unit 67
- 90 Northwoods Blvd Unit B
- 6800 Abbot Place
- 580 Mawyer Dr Unit 132
- 365 Cover Place
- 128 Green Springs Dr
- 8326 Bruntsfield Rd
- 696 Keys View Ct Unit 77
- 716 Alta View Ct Unit 33
- 737 Plant Dr Unit 2-C
- 865 Colony Way
- 796 Timber Way Dr Unit 15B
- 7697 Barkwood Dr Unit 1D
- 7981 Oakwind Ct
- 7522 Acela St
- 7599 Grotto Ct
- 7624 Chimes Ct
- 175 W Campus View Blvd
- 160 W Campus View Blvd
- 144 W Campus View Blvd
- 125 W Campus View Blvd
- 7587 Grotto Ct
- 7587 Grotto Ct Unit n/a
- 7596 Grotto Ct
- 132 W Campus View Blvd
- 187 W Campus View Blvd
- 7636 Chimes Ct
- 122 W Campus View Blvd
- 200 W Campus View Blvd
- 111 W Campus View Blvd
- 112 W Campus View Blvd
- 7635 Chimes Ct
- 95 W Campus View Blvd
- 211 W Campus View Blvd
- 220 W Campus View Blvd