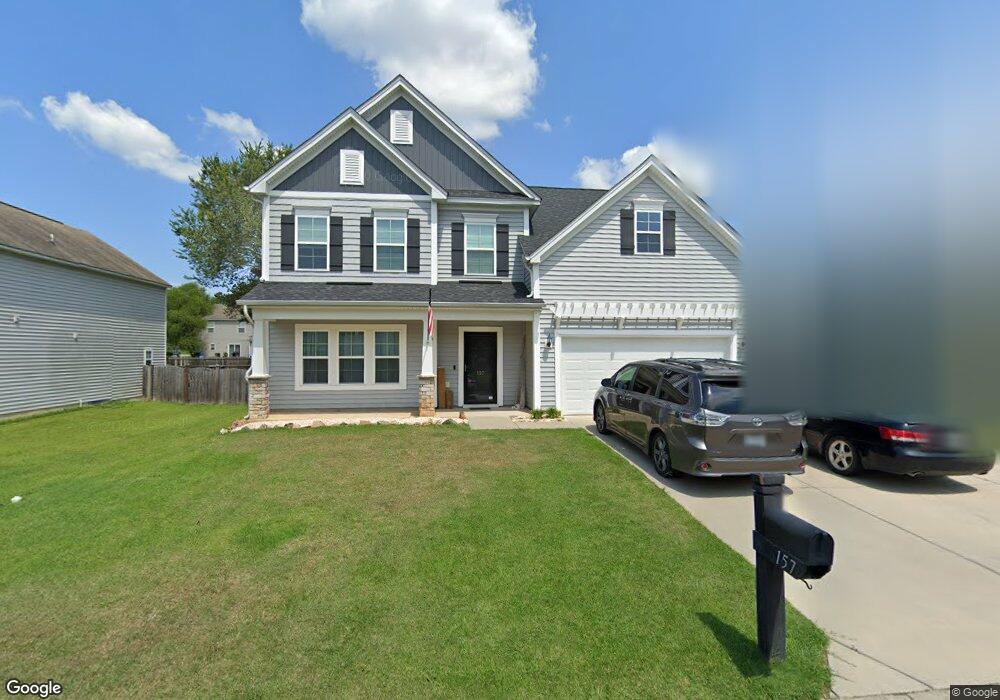
157 Wingspan Way Chapin, SC 29036
Estimated Value: $319,986 - $335,000
5
Beds
3
Baths
2,482
Sq Ft
$132/Sq Ft
Est. Value
About This Home
This home is located at 157 Wingspan Way, Chapin, SC 29036 and is currently estimated at $327,247, approximately $131 per square foot. 157 Wingspan Way is a home located in Lexington County with nearby schools including Chapin Elementary School, Chapin Intermediate, and Chapin High School.
Ownership History
Date
Name
Owned For
Owner Type
Purchase Details
Closed on
Aug 15, 2022
Sold by
Kevin Agard James
Bought by
Vsp2 Homes 4 Llc
Current Estimated Value
Purchase Details
Closed on
Jul 19, 2017
Sold by
Breck K Wilson
Bought by
Agard James and Agard Ashley
Home Financials for this Owner
Home Financials are based on the most recent Mortgage that was taken out on this home.
Original Mortgage
$191,468
Interest Rate
4.03%
Purchase Details
Closed on
Jun 13, 2014
Sold by
Mungo Homes Inc
Bought by
Wilson Breck K and Hire Wilson Brooke R
Purchase Details
Closed on
Jan 24, 2011
Sold by
Chapin New Town Llc
Bought by
Mungo Homes Inc
Home Financials for this Owner
Home Financials are based on the most recent Mortgage that was taken out on this home.
Original Mortgage
$35,000,000
Interest Rate
4.58%
Mortgage Type
New Conventional
Create a Home Valuation Report for This Property
The Home Valuation Report is an in-depth analysis detailing your home's value as well as a comparison with similar homes in the area
Home Values in the Area
Average Home Value in this Area
Purchase History
| Date | Buyer | Sale Price | Title Company |
|---|---|---|---|
| Vsp2 Homes 4 Llc | $314,500 | None Listed On Document | |
| Vsp2 Homes 4 Llc | $314,500 | None Listed On Document | |
| Agard James | $195,000 | -- | |
| Wilson Breck K | $189,750 | -- | |
| Mungo Homes Inc | $705,000 | -- |
Source: Public Records
Mortgage History
| Date | Status | Borrower | Loan Amount |
|---|---|---|---|
| Previous Owner | Agard James | $191,468 | |
| Previous Owner | Agard James | -- | |
| Previous Owner | Mungo Homes Inc | $35,000,000 |
Source: Public Records
Tax History Compared to Growth
Tax History
| Year | Tax Paid | Tax Assessment Tax Assessment Total Assessment is a certain percentage of the fair market value that is determined by local assessors to be the total taxable value of land and additions on the property. | Land | Improvement |
|---|---|---|---|---|
| 2024 | $8,034 | $18,870 | $1,500 | $17,370 |
| 2023 | $8,175 | $8,110 | $1,000 | $7,110 |
| 2022 | $1,252 | $8,110 | $1,000 | $7,110 |
| 2020 | $1,311 | $8,110 | $1,000 | $7,110 |
| 2019 | $1,283 | $7,800 | $1,000 | $6,800 |
| 2018 | $1,129 | $7,800 | $1,000 | $6,800 |
| 2017 | $0 | $7,590 | $1,000 | $6,590 |
| 2016 | -- | $7,590 | $1,000 | $6,590 |
| 2014 | $59 | $150 | $150 | $0 |
| 2013 | -- | $1,500 | $1,500 | $0 |
Source: Public Records
Map
Nearby Homes
- 814 Dutchmaster Dr
- 1431 Saugus Ct
- 147 Stuck's Point
- 153 Rushton Dr
- 1533 Saugus Ct
- 720 Topline St
- 117 Bay Front Dr
- 366 Gallery Cliff Dr
- 510 Lilypad Ct
- 228 Bickley View Ct
- 668 Clipper Trail
- 660 Clipper Trail
- 368 Frick Ct
- 100 Palm St
- 129 Monroe Preserve Dr
- 0 Mainsail Ln Unit 622256
- 339 Newberg Rd
- 634 Basalt Ct
- 373 Chapin Place Way
- 0 Dreher Island Rd Unit 21647709
- 155 Wingspan Way
- 159 Wingspan Way
- 153 Wingspan Way
- 161 Wingspan Way
- 371 Eagle Pointe Dr
- 375 Eagle Pointe Dr
- 367 Eagle Pointe Dr
- 379 Eagle Pointe Dr
- 151 Wingspan Way
- 163 Wingspan Way
- 156 Wingspan Way
- 383 Eagle Pointe Dr
- 154 Wingspan Way
- 158 Wingspan Way
- 152 Wingspan Way
- 149 Wingspan Way
- 359 Eagle Pointe Dr
- 165 Wingspan Way
- 150 Wingspan Way
- 162 Wingspan Way