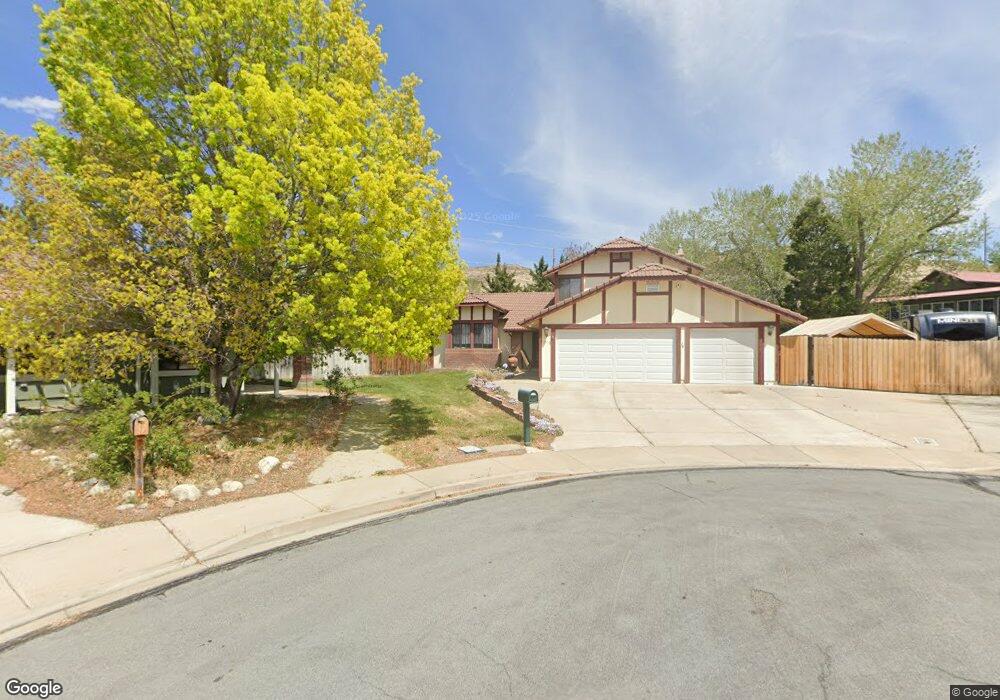
1570 Firman Ct Sparks, NV 89434
Reed NeighborhoodEstimated Value: $563,000 - $628,000
4
Beds
3
Baths
2,138
Sq Ft
$281/Sq Ft
Est. Value
About This Home
This home is located at 1570 Firman Ct, Sparks, NV 89434 and is currently estimated at $600,683, approximately $280 per square foot. 1570 Firman Ct is a home located in Washoe County with nearby schools including Jerry Whitehead Elementary School, Lou Mendive Middle School, and Edward C Reed High School.
Ownership History
Date
Name
Owned For
Owner Type
Purchase Details
Closed on
Feb 17, 2022
Sold by
James Frederick Jerry
Bought by
Frederick And Jansen Family Trust
Current Estimated Value
Purchase Details
Closed on
Nov 17, 2004
Sold by
Ross Loren H and Ross Deana K
Bought by
Frederick Jerry J and Jansen Debra J
Home Financials for this Owner
Home Financials are based on the most recent Mortgage that was taken out on this home.
Original Mortgage
$290,000
Interest Rate
5.72%
Mortgage Type
Unknown
Purchase Details
Closed on
Aug 18, 1995
Sold by
Buehler Mark C
Bought by
Ross Loren H and Ross Deana K
Home Financials for this Owner
Home Financials are based on the most recent Mortgage that was taken out on this home.
Original Mortgage
$188,550
Interest Rate
7.8%
Create a Home Valuation Report for This Property
The Home Valuation Report is an in-depth analysis detailing your home's value as well as a comparison with similar homes in the area
Home Values in the Area
Average Home Value in this Area
Purchase History
| Date | Buyer | Sale Price | Title Company |
|---|---|---|---|
| Frederick And Jansen Family Trust | -- | None Listed On Document | |
| Frederick Jerry J | $362,500 | Western Title Incorporated | |
| Ross Loren H | $209,500 | Stewart Title |
Source: Public Records
Mortgage History
| Date | Status | Borrower | Loan Amount |
|---|---|---|---|
| Previous Owner | Frederick Jerry J | $290,000 | |
| Previous Owner | Ross Loren H | $188,550 | |
| Closed | Frederick Jerry J | $72,500 |
Source: Public Records
Tax History Compared to Growth
Tax History
| Year | Tax Paid | Tax Assessment Tax Assessment Total Assessment is a certain percentage of the fair market value that is determined by local assessors to be the total taxable value of land and additions on the property. | Land | Improvement |
|---|---|---|---|---|
| 2025 | $2,431 | $92,720 | $41,538 | $51,182 |
| 2024 | $2,431 | $90,520 | $38,197 | $52,323 |
| 2023 | $2,360 | $90,570 | $40,451 | $50,118 |
| 2022 | $2,294 | $73,083 | $30,751 | $42,332 |
| 2021 | $2,227 | $67,601 | $24,995 | $42,606 |
| 2020 | $2,159 | $66,989 | $23,828 | $43,161 |
| 2019 | $2,098 | $65,587 | $23,828 | $41,759 |
| 2018 | $2,032 | $57,824 | $16,623 | $41,201 |
| 2017 | $1,977 | $57,445 | $15,778 | $41,667 |
| 2016 | $1,929 | $57,021 | $14,088 | $42,933 |
| 2015 | $1,928 | $55,304 | $11,874 | $43,430 |
| 2014 | $1,872 | $52,419 | $10,385 | $42,034 |
| 2013 | -- | $49,537 | $7,889 | $41,648 |
Source: Public Records
Map
Nearby Homes
- 1557 Satellite Dr
- 1475 Golddust Dr
- 3253 Clan Alpine Dr
- 3324 Danville Dr
- 3238 Candelaria Dr
- 3345 Groom Way
- 1575 Olinghouse St
- 4393 Acobat Ct
- 1484 Serendipity Ct
- 3221 Myles Dr
- 3127 Montezuma Way
- 3156 Waterfield Dr
- 1850 Almonte Ct
- 4675 Firtree Ln
- 1357 Silver View Cir
- 2316 Isabella Ct
- 4383 Setting Sun Ct Unit 1
- 2411 Tecumseh Way Unit 12
- 2415 Tecumseh Way
- 2427 Tecumseh Way Unit 8
- 3711 Vista Blvd
- 1560 Firman Ct
- 3751 Vista Blvd
- 1550 Firman Ct
- 3705 Vista Blvd
- 1600 Firman Ct
- 3623 Waterfall Ct
- 3633 Waterfall Ct
- 1540 Winterwood Ave
- 3643 Waterfall Ct
- 1524 Winterwood Ave
- 3653 Waterfall Ct
- 1630 Winterwood Ave
- 3613 Waterfall Ct
- 3701 B Vista Blvd
- 3701 Vista Blvd
- 1635 Winterwood Ave
- 1530 Winterwood Ave
- 1454 Heaven Dr
- 1683 Golddust Dr Unit 3A