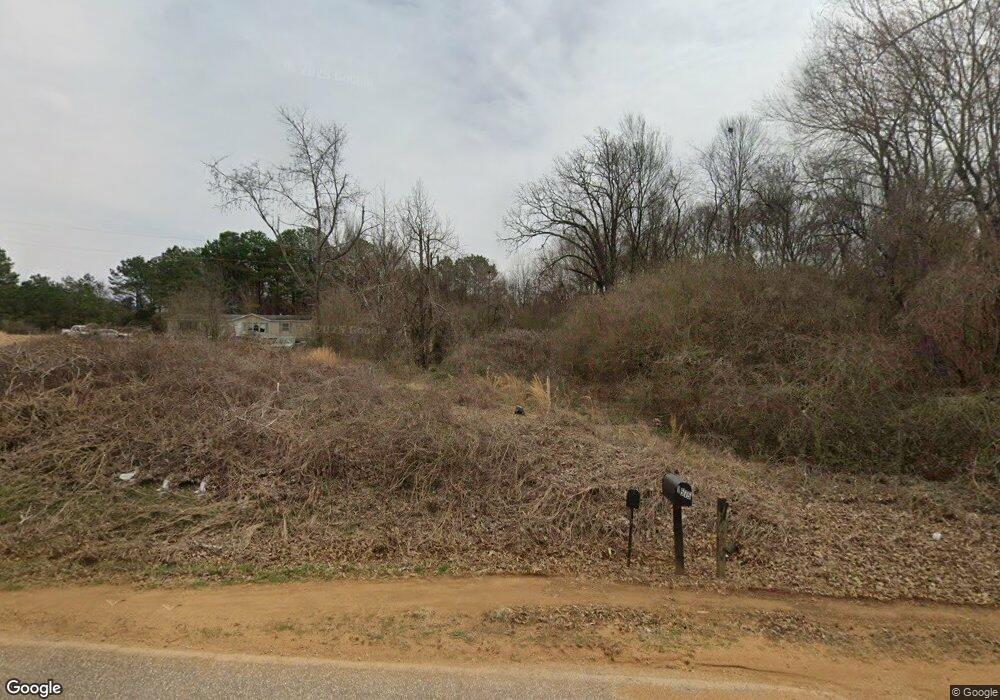
1570 Watkins Rd Michie, TN 38357
Estimated Value: $46,000 - $115,000
--
Bed
1
Bath
1,024
Sq Ft
$78/Sq Ft
Est. Value
About This Home
This home is located at 1570 Watkins Rd, Michie, TN 38357 and is currently estimated at $79,813, approximately $77 per square foot. 1570 Watkins Rd is a home located in Hardin County with nearby schools including Hardin County High School.
Ownership History
Date
Name
Owned For
Owner Type
Purchase Details
Closed on
May 17, 2008
Sold by
Edmond Ashley M
Bought by
Woods John R
Current Estimated Value
Home Financials for this Owner
Home Financials are based on the most recent Mortgage that was taken out on this home.
Original Mortgage
$37,311
Interest Rate
5.86%
Purchase Details
Closed on
Sep 10, 2002
Sold by
Sanders Dick S
Bought by
Edmonds Ashley M
Home Financials for this Owner
Home Financials are based on the most recent Mortgage that was taken out on this home.
Original Mortgage
$34,911
Interest Rate
6.3%
Purchase Details
Closed on
Nov 6, 1995
Bought by
Sanders Dick S
Purchase Details
Closed on
Jan 16, 1990
Bought by
Cromwell Lon and Cromwell Mildred
Purchase Details
Closed on
Dec 29, 1973
Bought by
Counce Kennie and Counce Linda
Purchase Details
Closed on
Feb 5, 1968
Bought by
Counce Kennie and Counce Linda
Purchase Details
Closed on
Feb 21, 1938
Create a Home Valuation Report for This Property
The Home Valuation Report is an in-depth analysis detailing your home's value as well as a comparison with similar homes in the area
Home Values in the Area
Average Home Value in this Area
Purchase History
| Date | Buyer | Sale Price | Title Company |
|---|---|---|---|
| Woods John R | $36,263 | -- | |
| Edmonds Ashley M | $31,600 | -- | |
| Sanders Dick S | $40,000 | -- | |
| Cromwell Lon | -- | -- | |
| Counce Kennie | -- | -- | |
| Counce Kennie | -- | -- | |
| -- | -- | -- |
Source: Public Records
Mortgage History
| Date | Status | Borrower | Loan Amount |
|---|---|---|---|
| Closed | Not Available | $37,311 | |
| Previous Owner | Not Available | $34,911 |
Source: Public Records
Tax History Compared to Growth
Tax History
| Year | Tax Paid | Tax Assessment Tax Assessment Total Assessment is a certain percentage of the fair market value that is determined by local assessors to be the total taxable value of land and additions on the property. | Land | Improvement |
|---|---|---|---|---|
| 2024 | $171 | $9,750 | $1,900 | $7,850 |
| 2023 | $171 | $9,750 | $1,900 | $7,850 |
| 2022 | $128 | $6,200 | $1,575 | $4,625 |
| 2021 | $128 | $6,200 | $1,575 | $4,625 |
| 2020 | $128 | $6,200 | $1,575 | $4,625 |
| 2019 | $128 | $6,200 | $1,575 | $4,625 |
| 2018 | $123 | $6,200 | $1,575 | $4,625 |
| 2017 | $122 | $5,850 | $1,575 | $4,275 |
| 2016 | $119 | $5,850 | $1,575 | $4,275 |
| 2015 | $104 | $5,700 | $1,575 | $4,125 |
| 2014 | $104 | $5,700 | $1,575 | $4,125 |
Source: Public Records
Map
Nearby Homes
- 30 Federal Rd
- 1035 Hill Dr
- 410 Gladden Rd
- 0 Baxter Rd
- 185 Baxter Rd
- 85 Aunt Bee Rd
- 3400 Tennessee 57
- 0 Leath Rd Unit LotWP001 24553817
- 0 Leath Rd
- 305 Damron Loop
- 330 Nash Landing Ln
- 330 Lick Creek Rd
- 1010 Kendrick Rd
- 1085 Arnold Ln
- 690 Declan Ln
- LOT 12 Declan Ln
- LOT 29 Declan Ln
- 1080 Declan Ln
- 865 Arnold Ln
- 715 Arnold Ln
- 1615 Watkins Rd
- 1575 Watkins Rd
- 1800 Watkins Rd
- 1500 Watkins Rd
- 4675 Highway 142
- 4775 Highway 142
- 1470 Watkins Rd
- 4640 Highway 142
- 1390 Watkins Rd
- 1375 Watkins Rd
- 2060 Watkins Rd
- 2060 Watkins Rd
- 4455 Highway 142
- 1 Kurtley Ln
- 0 Watkins Rd
- 2210 Watkins Rd
- 5130 Highway 142
- 5210 Highway 142
- 5210 Tennessee 142
- 4200 Highway 142