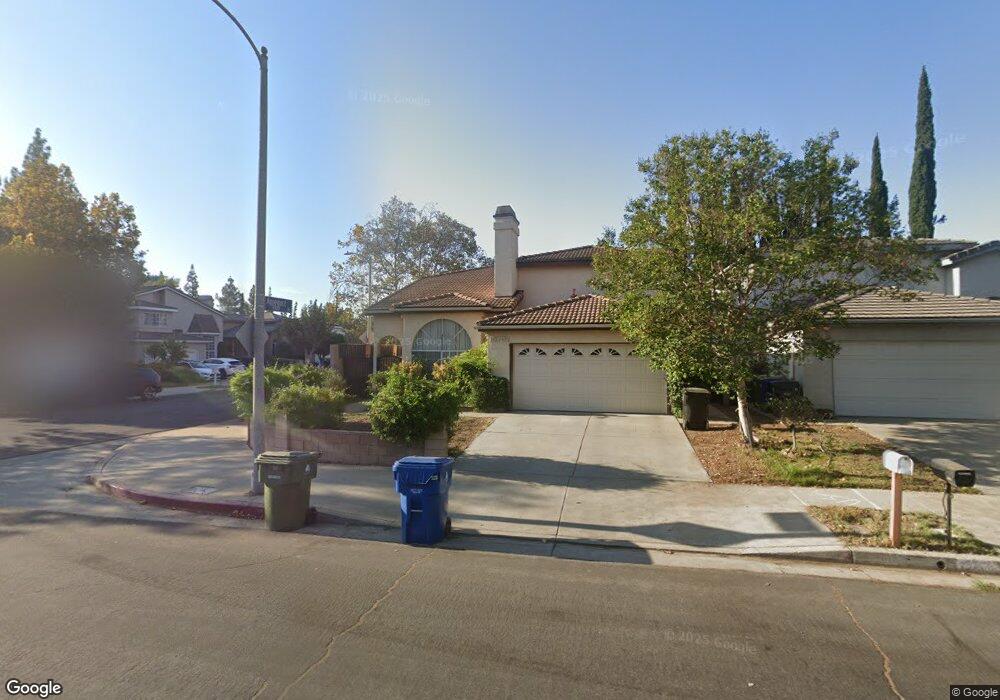
15702 Liggett St North Hills, CA 91343
Estimated Value: $881,000 - $1,299,000
3
Beds
3
Baths
2,252
Sq Ft
$464/Sq Ft
Est. Value
About This Home
This home is located at 15702 Liggett St, North Hills, CA 91343 and is currently estimated at $1,045,832, approximately $464 per square foot. 15702 Liggett St is a home located in Los Angeles County with nearby schools including Gledhill Street Elementary School, Oliver Wendell Holmes Middle School, and James Monroe High School.
Ownership History
Date
Name
Owned For
Owner Type
Purchase Details
Closed on
Dec 31, 2024
Sold by
Cain Frank Marvin and Cain Shawn Hartley
Bought by
Cain Frank Marvin and Cain Shawn Hartley
Current Estimated Value
Home Financials for this Owner
Home Financials are based on the most recent Mortgage that was taken out on this home.
Original Mortgage
$107,000
Outstanding Balance
$106,240
Interest Rate
6.69%
Mortgage Type
New Conventional
Estimated Equity
$939,592
Purchase Details
Closed on
Jul 11, 2024
Sold by
Joy Marlene Cain Living Trust and Cain Frank
Bought by
Cain Frank Marvin and Cain Shawn Hartley
Purchase Details
Closed on
Jan 30, 2016
Sold by
Cain Joy M
Bought by
The Joy Marlene Cain Living Trust
Purchase Details
Closed on
Nov 6, 1996
Sold by
Cain Frank M
Bought by
Cain Joy M
Create a Home Valuation Report for This Property
The Home Valuation Report is an in-depth analysis detailing your home's value as well as a comparison with similar homes in the area
Home Values in the Area
Average Home Value in this Area
Purchase History
| Date | Buyer | Sale Price | Title Company |
|---|---|---|---|
| Cain Frank Marvin | -- | Atlas Title | |
| Cain Frank Marvin | -- | Atlas Title | |
| Cain Shawn Hartley | -- | Atlas Title | |
| Cain Frank Marvin | -- | None Listed On Document | |
| The Joy Marlene Cain Living Trust | -- | None Available | |
| Cain Joy M | -- | -- |
Source: Public Records
Mortgage History
| Date | Status | Borrower | Loan Amount |
|---|---|---|---|
| Open | Cain Shawn Hartley | $107,000 | |
| Closed | Cain Frank Marvin | $0 |
Source: Public Records
Tax History Compared to Growth
Tax History
| Year | Tax Paid | Tax Assessment Tax Assessment Total Assessment is a certain percentage of the fair market value that is determined by local assessors to be the total taxable value of land and additions on the property. | Land | Improvement |
|---|---|---|---|---|
| 2025 | $5,886 | $902,000 | $630,000 | $272,000 |
| 2024 | $5,886 | $468,581 | $250,204 | $218,377 |
| 2023 | $5,774 | $459,395 | $245,299 | $214,096 |
| 2022 | $5,509 | $450,389 | $240,490 | $209,899 |
| 2021 | $5,432 | $441,559 | $235,775 | $205,784 |
| 2019 | $5,270 | $428,464 | $228,783 | $199,681 |
| 2018 | $5,204 | $420,064 | $224,298 | $195,766 |
| 2016 | $4,955 | $403,754 | $215,589 | $188,165 |
| 2015 | $4,883 | $397,690 | $212,351 | $185,339 |
| 2014 | $4,903 | $389,901 | $208,192 | $181,709 |
Source: Public Records
Map
Nearby Homes
- 9430 Haskell Ave
- 9419 Haskell Ave
- 15846 Liggett St
- 15735 Nordhoff St Unit 17
- 9038 Orion Ave Unit 107
- 9423 1/2 Sepulveda Blvd Unit 2
- 9423 1/2 Sepulveda Blvd Unit 4
- 9423 1/2 Sepulveda Blvd Unit 6
- 9423 N Sepulveda Blvd Unit 1
- Plan Four at Valley Villas
- 9429 N Sepulveda Blvd Unit 5
- 9429 N Sepulveda Blvd Unit 2
- 9047 Langdon Ave Unit 22
- 15929 Sunburst St
- 9635 Sepulveda Blvd Unit 1
- 9620 Sepulveda Blvd Unit 35
- 9620 Sepulveda Blvd Unit 39
- 9620 Sepulveda Blvd Unit 4
- 16118 Knapp St
- 16113 Gledhill St
- 15706 Liggett St
- 15712 Liggett St
- 15701 Tupper St
- 15705 Tupper St
- 9318 Aqueduct Ave
- 9312 Aqueduct Ave
- 15711 Tupper St
- 15716 Liggett St
- 9322 Aqueduct Ave
- 9306 Aqueduct Ave
- 15703 Liggett St
- 15707 Liggett St
- 9328 Aqueduct Ave
- 15715 Tupper St
- 15713 Liggett St
- 9300 Aqueduct Ave
- 15720 Liggett St
- 15717 Liggett St
- 9334 Aqueduct Ave
- 15719 Tupper St