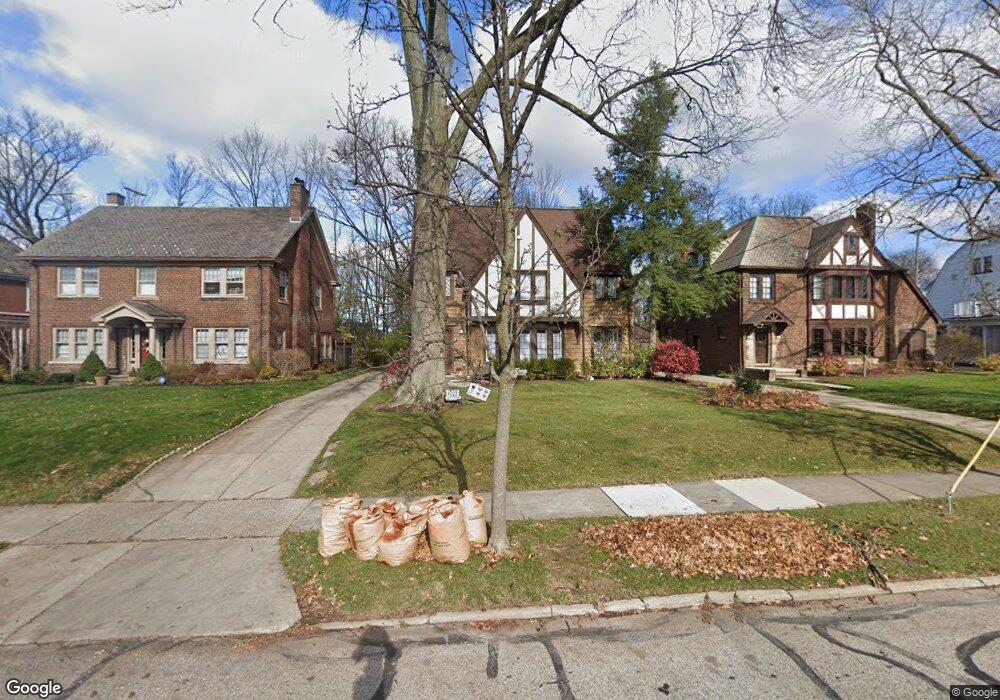
15709 Fernway Rd Cleveland, OH 44120
Estimated Value: $322,420 - $361,000
4
Beds
4
Baths
2,087
Sq Ft
$163/Sq Ft
Est. Value
About This Home
This home is located at 15709 Fernway Rd, Cleveland, OH 44120 and is currently estimated at $340,105, approximately $162 per square foot. 15709 Fernway Rd is a home located in Cuyahoga County with nearby schools including Onaway Elementary School, Woodbury Elementary School, and Shaker Heights Middle School.
Ownership History
Date
Name
Owned For
Owner Type
Purchase Details
Closed on
Feb 5, 2022
Sold by
Barrett Stephen G and Barrett Linda F
Bought by
Barrett-Jakob Family Trust
Current Estimated Value
Purchase Details
Closed on
Nov 20, 1997
Sold by
Asher David
Bought by
Barrett Steven G and Jakob Linda J
Home Financials for this Owner
Home Financials are based on the most recent Mortgage that was taken out on this home.
Original Mortgage
$108,000
Interest Rate
7.38%
Mortgage Type
New Conventional
Purchase Details
Closed on
Nov 8, 1991
Sold by
Haas Douglas E
Bought by
Asher David F
Purchase Details
Closed on
Jul 2, 1979
Sold by
William Allen Eva
Bought by
Haas Douglas E
Purchase Details
Closed on
Dec 30, 1977
Sold by
Eva William A and Eva Edith G
Bought by
William Allen Eva
Purchase Details
Closed on
Jan 1, 1975
Bought by
Eva William A and Eva Edith G
Create a Home Valuation Report for This Property
The Home Valuation Report is an in-depth analysis detailing your home's value as well as a comparison with similar homes in the area
Home Values in the Area
Average Home Value in this Area
Purchase History
| Date | Buyer | Sale Price | Title Company |
|---|---|---|---|
| Barrett-Jakob Family Trust | -- | Trubiano Mark A | |
| Barrett Steven G | $120,000 | -- | |
| Asher David F | $142,000 | -- | |
| Haas Douglas E | $80,500 | -- | |
| William Allen Eva | -- | -- | |
| Eva William A | -- | -- |
Source: Public Records
Mortgage History
| Date | Status | Borrower | Loan Amount |
|---|---|---|---|
| Previous Owner | Barrett Steven G | $108,000 |
Source: Public Records
Tax History Compared to Growth
Tax History
| Year | Tax Paid | Tax Assessment Tax Assessment Total Assessment is a certain percentage of the fair market value that is determined by local assessors to be the total taxable value of land and additions on the property. | Land | Improvement |
|---|---|---|---|---|
| 2024 | $7,254 | $80,920 | $22,435 | $58,485 |
| 2023 | $6,635 | $58,730 | $18,270 | $40,460 |
| 2022 | $6,606 | $58,730 | $18,270 | $40,460 |
| 2021 | $6,587 | $58,730 | $18,270 | $40,460 |
| 2020 | $5,290 | $44,240 | $17,080 | $27,160 |
| 2019 | $5,215 | $126,400 | $48,800 | $77,600 |
| 2018 | $6,238 | $44,240 | $17,080 | $27,160 |
| 2017 | $7,536 | $60,800 | $15,510 | $45,290 |
| 2016 | $7,241 | $60,800 | $15,510 | $45,290 |
| 2015 | $6,833 | $60,800 | $15,510 | $45,290 |
| 2014 | $6,833 | $55,270 | $14,110 | $41,160 |
Source: Public Records
Map
Nearby Homes
- 16005 Fernway Rd
- 3190 Warrington Rd
- 3283 Van Aken Blvd
- 3180 Chadbourne Rd
- 3340 Milverton Rd
- 15610 Van Aken Blvd Unit 5
- 3298 Milverton Rd
- 3380 Milverton Rd
- 3264 E 149th St
- 3378 Clayton Blvd
- 16125 Parkland Dr
- 3077 Huntington Rd
- 3261 E 147th St
- 14702 Milverton Rd
- 3420 Westbury Rd
- 3340 E 149th St
- 16100 Van Aken Blvd
- 0 Van Aken Blvd Unit 5021037
- 3313 E 146th St
- 3317 E 146th St
- 15701 Fernway Rd
- 15715 Fernway Rd
- 15617 Fernway Rd
- 15801 Fernway Rd
- 15803 Fernway Rd
- 15611 Fernway Rd
- 15718 Fernway Rd
- 15811 Fernway Rd
- 3239 Warrington Rd
- 15716 Aldersyde Dr
- 15806 Fernway Rd
- 3269 Warrington Rd
- 15817 Fernway Rd
- 15810 Aldersyde Dr
- 3233 Warrington Rd
- 3252 Enderby Rd
- 3271 Warrington Rd
- 15819 Fernway Rd
- 15702 Aldersyde Dr
- 15702 Aldersyde Dr Unit 1