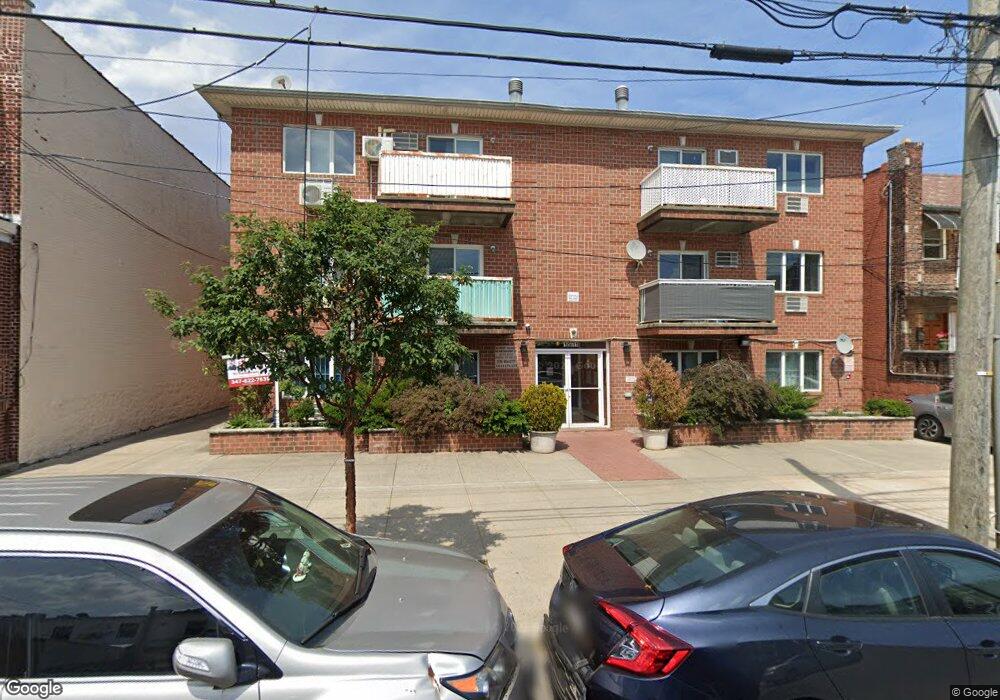
1571 67 St Unit 2A Brooklyn, NY 11219
Bensonhurst NeighborhoodEstimated Value: $616,000 - $741,000
2
Beds
2
Baths
811
Sq Ft
$836/Sq Ft
Est. Value
About This Home
This home is located at 1571 67 St Unit 2A, Brooklyn, NY 11219 and is currently estimated at $677,918, approximately $835 per square foot. 1571 67 St Unit 2A is a home located in Kings County with nearby schools including P.S. 112 Lefferts Park Elementary School, Junior High School 227 Edward B Shallow, and New Utrecht High School.
Ownership History
Date
Name
Owned For
Owner Type
Purchase Details
Closed on
Mar 16, 2022
Sold by
Yu Heung Kam
Bought by
Xu Vivien Jingyi and Zheng John Chipang
Current Estimated Value
Home Financials for this Owner
Home Financials are based on the most recent Mortgage that was taken out on this home.
Original Mortgage
$300,000
Outstanding Balance
$280,075
Interest Rate
3.85%
Mortgage Type
Purchase Money Mortgage
Estimated Equity
$397,843
Purchase Details
Closed on
Jun 24, 2002
Sold by
Huang Kristy Y
Bought by
Yu Heung Kam
Home Financials for this Owner
Home Financials are based on the most recent Mortgage that was taken out on this home.
Original Mortgage
$145,000
Interest Rate
6.73%
Purchase Details
Closed on
Feb 7, 2001
Sold by
1571 67 Street Corp
Bought by
Huang Kristy Y and Lau Tak Fai
Home Financials for this Owner
Home Financials are based on the most recent Mortgage that was taken out on this home.
Original Mortgage
$168,000
Interest Rate
7.2%
Create a Home Valuation Report for This Property
The Home Valuation Report is an in-depth analysis detailing your home's value as well as a comparison with similar homes in the area
Home Values in the Area
Average Home Value in this Area
Purchase History
| Date | Buyer | Sale Price | Title Company |
|---|---|---|---|
| Xu Vivien Jingyi | $500,000 | -- | |
| Yu Heung Kam | -- | -- | |
| Huang Kristy Y | -- | -- |
Source: Public Records
Mortgage History
| Date | Status | Borrower | Loan Amount |
|---|---|---|---|
| Open | Xu Vivien Jingyi | $300,000 | |
| Previous Owner | Yu Heung Kam | $145,000 | |
| Previous Owner | Huang Kristy Y | $168,000 |
Source: Public Records
Tax History Compared to Growth
Tax History
| Year | Tax Paid | Tax Assessment Tax Assessment Total Assessment is a certain percentage of the fair market value that is determined by local assessors to be the total taxable value of land and additions on the property. | Land | Improvement |
|---|---|---|---|---|
| 2025 | $6,246 | $48,231 | $3,339 | $44,892 |
| 2024 | $6,246 | $41,148 | $3,339 | $37,809 |
| 2023 | $6,237 | $39,198 | $3,339 | $35,859 |
| 2022 | $5,497 | $36,138 | $3,339 | $32,799 |
| 2021 | $5,456 | $31,459 | $3,339 | $28,120 |
| 2020 | $4,092 | $32,168 | $3,339 | $28,829 |
| 2019 | $5,129 | $33,860 | $3,339 | $30,521 |
| 2018 | $4,919 | $25,592 | $2,717 | $22,875 |
| 2017 | $4,622 | $24,144 | $2,766 | $21,378 |
| 2016 | $4,244 | $22,778 | $2,945 | $19,833 |
| 2015 | $693 | $21,597 | $2,564 | $19,033 |
| 2014 | $693 | $21,597 | $3,076 | $18,521 |
Source: Public Records
Map
Nearby Homes
- 6810 16th Ave
- 1536 68th St
- 6801 New Utrecht Ave
- 1529 67th St
- 1620 68th St
- 1564 Bay Ridge Ave
- 1523 67th St
- 1482 67th St Unit 2
- 6909 15th Ave
- 6519 15th Ave
- 1470 Ovington Ave
- 1516 70th St
- 1677 Bay Ridge Ave
- 1519 71st St
- 6623 Wallaston Ct
- 1456 Bay Ridge Ave
- 1530 71st St
- 6610 17th Ave
- 1444 Bay Ridge Ave
- 1535 64th St
- 1571 67 St Unit 2D
- 1571 67 St Unit 2C
- 1571 67th St Unit 3F
- 1571 67th St Unit 3E
- 1571 67th St Unit 3D
- 1571 67th St Unit 3C
- 1571 67th St Unit 3B
- 1571 67th St Unit 3A
- 1571 67th St Unit 2F
- 1571 67th St Unit 2E
- 1571 67th St Unit 2D
- 1571 67th St Unit 2C
- 1571 67th St Unit 2B
- 1571 67th St Unit 2A
- 1571 67th St Unit 1F
- 1571 67th St Unit 1E
- 1571 67th St Unit 1D
- 1571 67th St Unit 1C
- 1571 67th St Unit 1B
- 1571 67th St Unit 1A