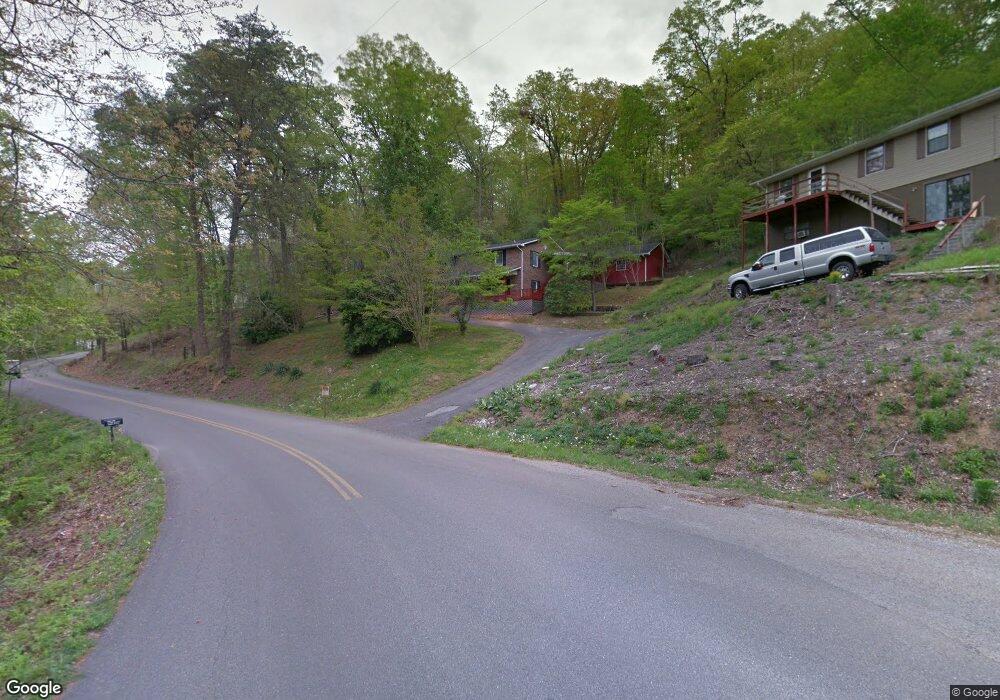
1571 Alder Springs Rd La Follette, TN 37766
Estimated Value: $365,000 - $497,000
3
Beds
2
Baths
1,872
Sq Ft
$229/Sq Ft
Est. Value
About This Home
This home is located at 1571 Alder Springs Rd, La Follette, TN 37766 and is currently estimated at $428,229, approximately $228 per square foot. 1571 Alder Springs Rd is a home located in Campbell County.
Ownership History
Date
Name
Owned For
Owner Type
Purchase Details
Closed on
Jul 30, 2024
Sold by
Bedinghaus Richard T and Bedinghaus Joyce L
Bought by
Bedinghaus Family Trust and Bedinghaus
Current Estimated Value
Purchase Details
Closed on
May 20, 2014
Sold by
Lesseuer Rudolph S Estate
Bought by
Bedinghaus Richard T and Bedinghaus Joyce L
Home Financials for this Owner
Home Financials are based on the most recent Mortgage that was taken out on this home.
Original Mortgage
$90,000
Interest Rate
4.4%
Mortgage Type
New Conventional
Purchase Details
Closed on
Jul 20, 2010
Sold by
Lesseuer Ruby
Bought by
Lesseuer Rudy
Purchase Details
Closed on
Jan 24, 2005
Sold by
Lewis Garrett and Lewis Maggie
Bought by
Lesseuer Rudy
Purchase Details
Closed on
Jul 28, 1988
Bought by
Lewis Garrett and Lewis Maggie
Purchase Details
Closed on
Oct 23, 1985
Bought by
Creger Paul and Creger Jack
Purchase Details
Closed on
Sep 3, 1982
Purchase Details
Closed on
Feb 5, 1979
Purchase Details
Closed on
Jul 6, 1976
Create a Home Valuation Report for This Property
The Home Valuation Report is an in-depth analysis detailing your home's value as well as a comparison with similar homes in the area
Home Values in the Area
Average Home Value in this Area
Purchase History
| Date | Buyer | Sale Price | Title Company |
|---|---|---|---|
| Bedinghaus Family Trust | -- | None Listed On Document | |
| Bedinghaus Richard T | $112,500 | -- | |
| Lesseuer Rudy | $8,785 | -- | |
| Lesseuer Rudy | $125,000 | -- | |
| Lewis Garrett | $6,500 | -- | |
| Creger Paul | -- | -- | |
| -- | -- | -- | |
| -- | -- | -- | |
| -- | -- | -- |
Source: Public Records
Mortgage History
| Date | Status | Borrower | Loan Amount |
|---|---|---|---|
| Previous Owner | Bedinghaus Richard T | $90,000 |
Source: Public Records
Tax History Compared to Growth
Tax History
| Year | Tax Paid | Tax Assessment Tax Assessment Total Assessment is a certain percentage of the fair market value that is determined by local assessors to be the total taxable value of land and additions on the property. | Land | Improvement |
|---|---|---|---|---|
| 2025 | $828 | $68,100 | $0 | $0 |
| 2024 | $828 | $68,100 | $7,650 | $60,450 |
| 2023 | $708 | $34,250 | $3,625 | $30,625 |
| 2022 | $708 | $34,250 | $3,625 | $30,625 |
| 2021 | $708 | $34,250 | $3,625 | $30,625 |
| 2020 | $694 | $34,250 | $3,625 | $30,625 |
| 2019 | $708 | $34,250 | $3,625 | $30,625 |
| 2018 | $854 | $37,975 | $3,750 | $34,225 |
| 2017 | $854 | $37,975 | $3,750 | $34,225 |
| 2016 | $854 | $37,975 | $3,750 | $34,225 |
| 2015 | $756 | $37,975 | $3,750 | $34,225 |
| 2014 | -- | $37,975 | $3,750 | $34,225 |
| 2013 | -- | $37,975 | $3,750 | $34,225 |
Source: Public Records
Map
Nearby Homes
- 309 Alder Shore Ln
- 195 Kennedys Loop
- 0 Lakesprings Dr Unit 1315301
- 150 E Harbor View Ln
- 118 E Harbor View Ln Unit A
- 118 E Harbor View Ln Unit B
- 135 N Deer Hill Village Ln Unit A
- 131 N Deer Village Ln Unit B
- Lot10 Chapman Rd
- 207 N Deer Hill Village Unit A
- 195 N Deer Village Ln Unit B
- Lot 8 Chapman Rd
- Lot 3 Chapman Rd
- Lot 2 Chapman Rd
- Lot 7 Chapman Rd
- Lot 6 Chapman Rd
- Lot 9 Chapman Rd
- Lot 1 Chapman Rd
- Lot 4 Chapman Rd
- Lot 5 Chapman Rd
- 1575 Alder Springs Rd
- Lot 53 Alder Springs Rd
- 396 Pearl Dr
- 1652 Springs Dock Rd
- 206 Cross Rd
- 332 Pearl Dr
- 1454 Springs Dock Rd
- 345 Pearl Dr
- 376 Pearl Dr
- 259 Dogwood Acres
- 225 Dogwood Acres
- 1525 Alder Springs Rd
- 309 Pearl Dr
- 316 Pearl Rd
- 1515 Alder Springs Rd
- 221 Dogwood Trail
- 275 Dogwood Acres
- 238 Dogwood Acres
- 228 Dogwood Acres
- 258 Dogwood Acres