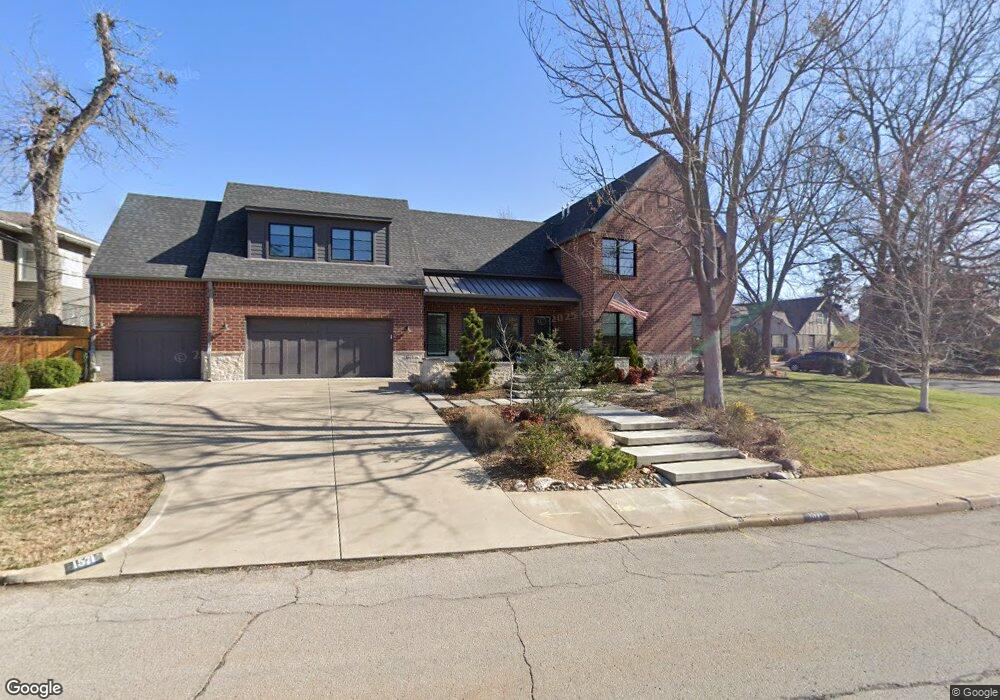
1571 E 22nd Place Tulsa, OK 74114
Garden District NeighborhoodEstimated Value: $1,006,000 - $1,070,000
Studio
4
Baths
3,588
Sq Ft
$291/Sq Ft
Est. Value
About This Home
This home is located at 1571 E 22nd Place, Tulsa, OK 74114 and is currently estimated at $1,044,583, approximately $291 per square foot. 1571 E 22nd Place is a home located in Tulsa County with nearby schools including Council Oak Elementary School, Edison Preparatory School, and Thomas Edison Preparatory High School.
Ownership History
Date
Name
Owned For
Owner Type
Purchase Details
Closed on
Jul 31, 2015
Sold by
Miggins John Christopher and Miggins Debra Lynn
Bought by
Hornbrook Patricia Rosemary
Current Estimated Value
Purchase Details
Closed on
Oct 18, 2010
Sold by
Miggins John Christopher and Miggins Debra Lynn
Bought by
Miggins John Christopher and Miggins Debra Lynn
Home Financials for this Owner
Home Financials are based on the most recent Mortgage that was taken out on this home.
Original Mortgage
$257,700
Interest Rate
4.41%
Mortgage Type
New Conventional
Purchase Details
Closed on
Feb 28, 2009
Sold by
Green Team Realty Group Llc
Bought by
Miggins Johnc and Miggins Debra Lynn
Create a Home Valuation Report for This Property
The Home Valuation Report is an in-depth analysis detailing your home's value as well as a comparison with similar homes in the area
Home Values in the Area
Average Home Value in this Area
Purchase History
| Date | Buyer | Sale Price | Title Company |
|---|---|---|---|
| Hornbrook Patricia Rosemary | $395,000 | Firstitle & Abstract Svcs Ll | |
| Miggins John Christopher | -- | Firstitle & Abstract Service | |
| Miggins Debra Lynn | -- | Firstitle & Abstract Service | |
| Miggins Johnc | $12,000 | None Available |
Source: Public Records
Mortgage History
| Date | Status | Borrower | Loan Amount |
|---|---|---|---|
| Previous Owner | Miggins John Christopher | $257,700 | |
| Closed | Miggins Johnc | $0 |
Source: Public Records
Tax History
| Year | Tax Paid | Tax Assessment Tax Assessment Total Assessment is a certain percentage of the fair market value that is determined by local assessors to be the total taxable value of land and additions on the property. | Land | Improvement |
|---|---|---|---|---|
| 2025 | $14,748 | $110,053 | $28,022 | $82,031 |
| 2024 | $13,158 | $106,820 | $31,116 | $75,704 |
| 2023 | $13,158 | $104,679 | $32,676 | $72,003 |
| 2022 | $13,416 | $100,630 | $31,412 | $69,218 |
| 2021 | $12,899 | $97,670 | $30,488 | $67,182 |
| 2020 | $12,723 | $97,670 | $30,488 | $67,182 |
| 2019 | $13,383 | $97,670 | $32,666 | $65,004 |
| 2018 | $13,414 | $97,670 | $32,666 | $65,004 |
| 2017 | $2,259 | $16,478 | $16,478 | $0 |
| 2016 | $5,833 | $43,450 | $16,478 | $26,972 |
| 2015 | $4,380 | $34,404 | $16,478 | $17,926 |
| 2014 | $4,208 | $34,404 | $16,478 | $17,926 |
Source: Public Records
Map
Nearby Homes
- 2252 S Troost Ave
- 2251 S Saint Louis Ave
- 2261 S Terwilleger Blvd
- 1425 E 21st St
- 2605 S Saint Louis Ave
- 1420 E 17th Place Unit B
- 1343 E 19th St
- 1715 S Saint Louis Ave
- 2126 E 24th St
- 1315 E 26th St
- 1746 S Yorktown Ave
- 1628 S Victor Ave
- 2116 E 18th St
- 1624 S Victor Ave
- 2245 E 22nd Place
- 1305 E 27th St
- 2102 E 17th St
- 1246 Hazel Blvd
- 2227 E 26th Place
- 1610 S Lewis Ave
- 1565 E 22nd Place
- 2216 S Troost Ave
- 1570 E 22nd Place
- 2215 S Saint Louis Ave
- 2225 S Troost Ave
- 2221 S Troost Ave
- 2204 S Troost Ave
- 2229 S Troost Ave
- 2229 S Saint Louis Ave
- 2229 S St Louis Ave
- 1566 E 22nd St
- 2217 S Troost Ave
- 2240 S Troost Ave
- 2202 S Troost Ave
- 2235 S Troost Ave
- 1562 E 22nd St
- 2205 S Troost Ave
- 2235 S Saint Louis Ave
- 2235 S St Louis Ave
- 2237 S Troost Ave
Your Personal Tour Guide
Ask me questions while you tour the home.