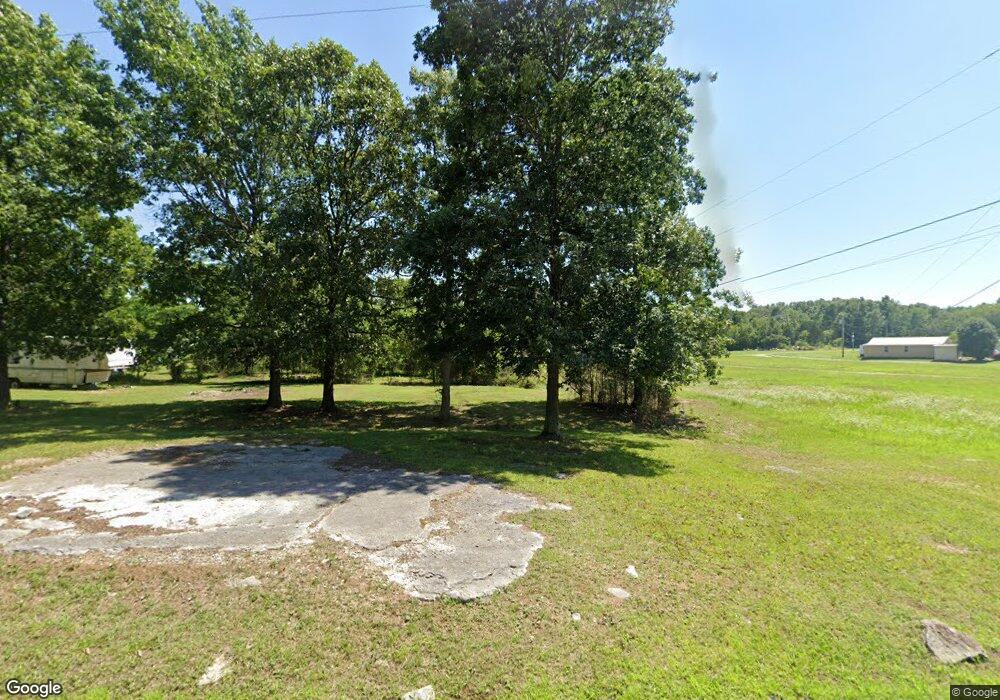
1571 Finley Beech Rd Lewisburg, TN 37091
Estimated Value: $118,000 - $207,000
--
Bed
1
Bath
992
Sq Ft
$160/Sq Ft
Est. Value
About This Home
This home is located at 1571 Finley Beech Rd, Lewisburg, TN 37091 and is currently estimated at $159,119, approximately $160 per square foot. 1571 Finley Beech Rd is a home located in Marshall County with nearby schools including Oak Grove Elementary School, Marshall Elementary School, and Westhills Elementary School.
Ownership History
Date
Name
Owned For
Owner Type
Purchase Details
Closed on
Sep 13, 2022
Sold by
John Mullins Michael
Bought by
Mclean Shannon and Mclean Stephanie
Current Estimated Value
Home Financials for this Owner
Home Financials are based on the most recent Mortgage that was taken out on this home.
Original Mortgage
$12,000
Outstanding Balance
$11,440
Interest Rate
4.99%
Mortgage Type
New Conventional
Estimated Equity
$147,679
Purchase Details
Closed on
Jan 6, 2021
Sold by
Mullins James Aldrage
Bought by
Mullins John
Purchase Details
Closed on
Apr 24, 2018
Sold by
Flynt Johnny B
Bought by
Mullins James Aldrage Se
Purchase Details
Closed on
Dec 11, 2014
Sold by
Mullins James Aldrage
Bought by
Flynt Johnny B and Flynt Martha Ann
Purchase Details
Closed on
Jul 30, 2013
Sold by
Flynt Martha Ann
Bought by
Flynt Martha Ann and Mullins James Aldrage
Purchase Details
Closed on
Apr 15, 1996
Sold by
Boyd Flynt Johnny
Bought by
Frank Mullins James
Create a Home Valuation Report for This Property
The Home Valuation Report is an in-depth analysis detailing your home's value as well as a comparison with similar homes in the area
Home Values in the Area
Average Home Value in this Area
Purchase History
| Date | Buyer | Sale Price | Title Company |
|---|---|---|---|
| Mclean Shannon | $12,000 | Security Title | |
| Mullins John | -- | None Available | |
| Mullins James Aldrage Se | $1,500 | -- | |
| Flynt Johnny B | $5,000 | -- | |
| Flynt Martha Ann | $1,000 | -- | |
| Frank Mullins James | $25,000 | -- |
Source: Public Records
Mortgage History
| Date | Status | Borrower | Loan Amount |
|---|---|---|---|
| Open | Mclean Shannon | $12,000 |
Source: Public Records
Tax History Compared to Growth
Tax History
| Year | Tax Paid | Tax Assessment Tax Assessment Total Assessment is a certain percentage of the fair market value that is determined by local assessors to be the total taxable value of land and additions on the property. | Land | Improvement |
|---|---|---|---|---|
| 2024 | $432 | $23,775 | $13,400 | $10,375 |
| 2023 | $432 | $23,775 | $13,400 | $10,375 |
| 2022 | $291 | $15,975 | $5,600 | $10,375 |
| 2021 | $253 | $9,000 | $3,525 | $5,475 |
| 2020 | $253 | $9,000 | $3,525 | $5,475 |
| 2019 | $260 | $9,000 | $3,525 | $5,475 |
| 2018 | $255 | $9,250 | $3,525 | $5,725 |
| 2017 | $255 | $9,250 | $3,525 | $5,725 |
| 2016 | $237 | $7,350 | $3,125 | $4,225 |
| 2015 | $237 | $7,350 | $3,125 | $4,225 |
| 2014 | $237 | $7,350 | $3,125 | $4,225 |
Source: Public Records
Map
Nearby Homes
- 0 Finley Beech Unit RTC2945449
- 1511 Finley Beech Rd
- Ashbury Plan at Spring Valley Estates - Grandview Collection
- Primrose Plan at Spring Valley Estates - Classic Collection
- 1011 Curtis Springs Ln
- Alan Plan at Spring Valley Estates - Grandview Collection
- 1013 Curtis Springs Ln
- 1015 Curtis Springs Ln
- 1019 Curtis Springs Ln
- Rosemary Plan at Spring Valley Estates - Classic Collection
- 1019 Curtis Spring Ln
- 197 Creekside Dr
- 199 Creekside Dr
- 198 Creekside Dr
- 200 Creekside Dr
- 3021 Cambridge Ct
- 3019 Cambridge Ct
- 1183 Finley Beech Rd
- 1666 Fayetteville Hwy
- 141 Isabela Dr
- 1565 Finley Beech Rd
- 1573 Finley Beech Rd
- 1595 Finley Beech Rd
- 1559 Finley Beech Rd
- 1576 Finley Beech Rd
- 1545 Finley Beech Rd
- 1612 Finley Beech Rd
- 1627 Finley Beech Rd
- 1554 Finley Beech Rd
- 1626 Finley Beech Rd
- 1521 Finley Beech Rd
- 0 Finley Beech Unit 1877332
- 0 Finley Beech Unit 1623950
- 0 Finley Beech Unit 1679764
- 0 Finley Beech Unit 1807160
- 0 Finley Beech Unit 1762906
- 0 Finley Beech Unit 1812212
- 0 Finley Beech Unit RTC2632833
- 0 Finley Beech Unit 2253634
- 0 Finley Beech Unit 2253484