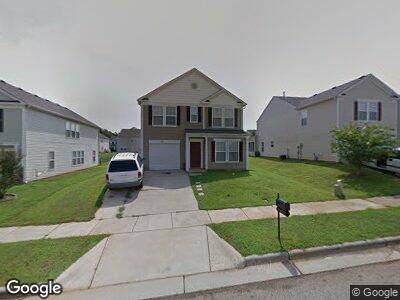
1571 Matthew Allen Cir Kannapolis, NC 28081
Estimated Value: $315,000 - $344,000
3
Beds
3
Baths
2,012
Sq Ft
$165/Sq Ft
Est. Value
About This Home
This home is located at 1571 Matthew Allen Cir, Kannapolis, NC 28081 and is currently estimated at $332,419, approximately $165 per square foot. 1571 Matthew Allen Cir is a home located in Cabarrus County with nearby schools including Winecoff Elementary School, Northwest Cabarrus Middle School, and Northwest Cabarrus High.
Ownership History
Date
Name
Owned For
Owner Type
Purchase Details
Closed on
May 5, 2020
Sold by
Chase Drm Llc
Bought by
Harrington Horace and Harrington Josephine
Current Estimated Value
Home Financials for this Owner
Home Financials are based on the most recent Mortgage that was taken out on this home.
Original Mortgage
$205,000
Outstanding Balance
$183,633
Interest Rate
3.3%
Mortgage Type
VA
Estimated Equity
$148,786
Purchase Details
Closed on
Feb 19, 2020
Sold by
Vazquez Frank E
Bought by
Chase Drm Llc
Home Financials for this Owner
Home Financials are based on the most recent Mortgage that was taken out on this home.
Original Mortgage
$148,500
Interest Rate
3.4%
Mortgage Type
Commercial
Purchase Details
Closed on
Dec 6, 2006
Sold by
C P Morgan Communities Of Charlotte Llc
Bought by
Vazquez Frank E
Home Financials for this Owner
Home Financials are based on the most recent Mortgage that was taken out on this home.
Original Mortgage
$147,705
Interest Rate
8.15%
Mortgage Type
Purchase Money Mortgage
Create a Home Valuation Report for This Property
The Home Valuation Report is an in-depth analysis detailing your home's value as well as a comparison with similar homes in the area
Home Values in the Area
Average Home Value in this Area
Purchase History
| Date | Buyer | Sale Price | Title Company |
|---|---|---|---|
| Harrington Horace | $205,000 | None Available | |
| Chase Drm Llc | $165,000 | None Available | |
| Vazquez Frank E | $148,000 | None Available |
Source: Public Records
Mortgage History
| Date | Status | Borrower | Loan Amount |
|---|---|---|---|
| Open | Harrington Horace | $205,000 | |
| Previous Owner | Chase Drm Llc | $148,500 | |
| Previous Owner | Vazquez Frank E | $147,705 |
Source: Public Records
Tax History Compared to Growth
Tax History
| Year | Tax Paid | Tax Assessment Tax Assessment Total Assessment is a certain percentage of the fair market value that is determined by local assessors to be the total taxable value of land and additions on the property. | Land | Improvement |
|---|---|---|---|---|
| 2024 | $2,954 | $305,110 | $65,000 | $240,110 |
| 2023 | $1,981 | $189,610 | $38,000 | $151,610 |
| 2022 | $1,981 | $189,610 | $38,000 | $151,610 |
| 2021 | $1,981 | $189,610 | $38,000 | $151,610 |
| 2020 | $2,409 | $175,860 | $38,000 | $137,860 |
| 2019 | $1,801 | $131,460 | $20,000 | $111,460 |
| 2018 | $1,775 | $131,460 | $20,000 | $111,460 |
| 2017 | $1,748 | $131,460 | $20,000 | $111,460 |
| 2016 | $1,748 | $127,410 | $23,000 | $104,410 |
| 2015 | $1,605 | $127,410 | $23,000 | $104,410 |
| 2014 | $1,605 | $127,410 | $23,000 | $104,410 |
Source: Public Records
Map
Nearby Homes
- 1613 Frederick Ave
- 1505 S Ridge Ave
- 303 Windy Rush Rd
- 125 Lowrance Ave
- 602 Black Maple Dr
- 1216 Innis Ave
- 681 Pine Bluff Cir
- 1425 Wildwood Dr
- 1412 Meadow Ave
- 1304 Browdis Ave
- 410 Glass Ct
- 701 Applewood St
- 1105 Horton Ave
- 2001 S Main St
- 1311 Meadow Ave
- 1309 Meadow Ave
- 127 Eddleman Rd
- 206 Cliffside Dr
- 123 Carriage House Dr
- 308 Odell Dr
- 1571 Matthew Allen Cir
- 1571 Matthew Allen Cir Unit 51
- 1575 Matthew Allen Cir
- 1565 Matthew Allen Cir
- 1585 Matthew Allen Cir
- 1559 Matthew Allen Cir
- 1444 Tygress St
- 1448 Tygress St
- 1440 Tygress St
- 1589 Matthew Allen Cir
- 1543 Matthew Allen Cir
- 1452 Tygress St
- 1436 Tygress St
- 1572 Matthew Allen Cir
- 1578 Matthew Allen Cir
- 1566 Matthew Allen Cir
- 1456 Tygress St
- 1584 Matthew Allen Cir
- 1595 Matthew Allen Cir
- 1560 Matthew Allen Cir