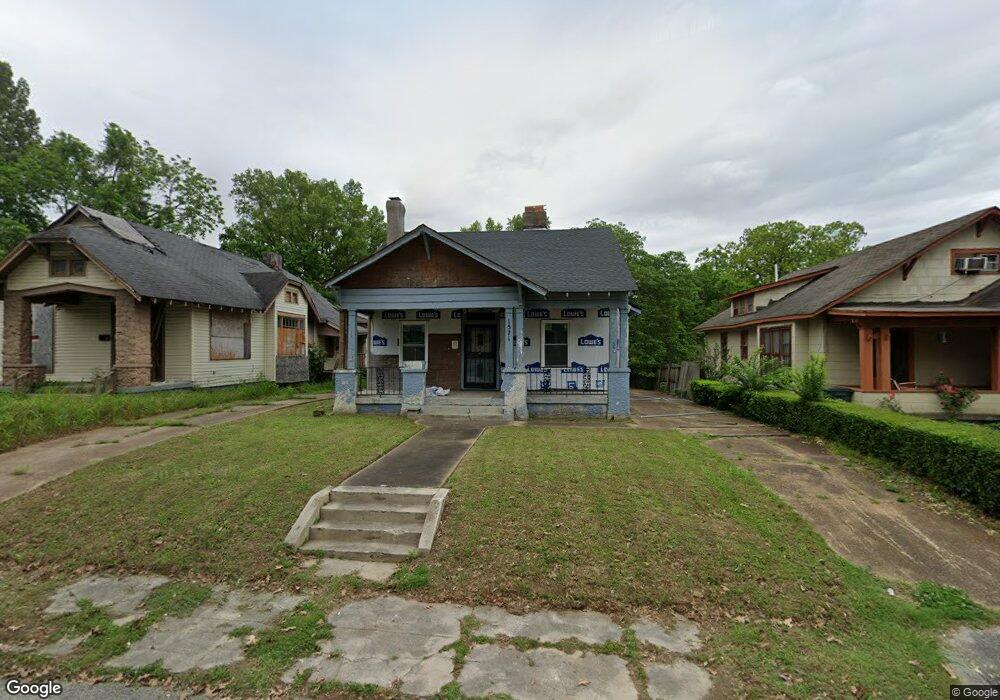
1571 Waverly Ave Memphis, TN 38106
Southeast Memphis NeighborhoodEstimated Value: $83,133 - $96,000
4
Beds
1
Bath
2,342
Sq Ft
$38/Sq Ft
Est. Value
About This Home
This home is located at 1571 Waverly Ave, Memphis, TN 38106 and is currently estimated at $88,033, approximately $37 per square foot. 1571 Waverly Ave is a home located in Shelby County with nearby schools including Rozelle Elementary School, Hamilton High School, and Memphis Delta Preparatory Charter School.
Ownership History
Date
Name
Owned For
Owner Type
Purchase Details
Closed on
Jun 2, 2014
Sold by
Peters Hagen
Bought by
Huggins Jimmy L and Huggins Joyce E
Current Estimated Value
Purchase Details
Closed on
Dec 15, 2003
Sold by
Talmadge Properties
Bought by
Peters Hagen
Purchase Details
Closed on
Dec 11, 2003
Sold by
Household Financial Center Inc
Bought by
Talmadge Properties
Purchase Details
Closed on
Apr 23, 2003
Sold by
Taylor Tina
Bought by
Household Financial Center Inc
Purchase Details
Closed on
Feb 2, 2001
Sold by
Rice Kennitha
Bought by
Taylor Tina
Home Financials for this Owner
Home Financials are based on the most recent Mortgage that was taken out on this home.
Original Mortgage
$49,300
Interest Rate
12.54%
Purchase Details
Closed on
May 10, 2000
Sold by
Blessed Investment Llc
Bought by
Rice Kennitha
Purchase Details
Closed on
Jul 15, 1999
Sold by
Gunn Yolanda M
Bought by
Hud
Create a Home Valuation Report for This Property
The Home Valuation Report is an in-depth analysis detailing your home's value as well as a comparison with similar homes in the area
Home Values in the Area
Average Home Value in this Area
Purchase History
| Date | Buyer | Sale Price | Title Company |
|---|---|---|---|
| Huggins Jimmy L | $9,500 | None Available | |
| Peters Hagen | -- | -- | |
| Talmadge Properties | $26,000 | -- | |
| Household Financial Center Inc | $48,070 | -- | |
| Taylor Tina | $58,000 | -- | |
| Rice Kennitha | -- | Equity Title & Escrow Co | |
| Hud | $49,138 | -- |
Source: Public Records
Mortgage History
| Date | Status | Borrower | Loan Amount |
|---|---|---|---|
| Previous Owner | Taylor Tina | $49,300 |
Source: Public Records
Tax History Compared to Growth
Tax History
| Year | Tax Paid | Tax Assessment Tax Assessment Total Assessment is a certain percentage of the fair market value that is determined by local assessors to be the total taxable value of land and additions on the property. | Land | Improvement |
|---|---|---|---|---|
| 2025 | $616 | $16,750 | $6,575 | $10,175 |
| 2024 | $616 | $18,175 | $1,250 | $16,925 |
| 2023 | $1,107 | $18,175 | $1,250 | $16,925 |
| 2022 | $624 | $10,250 | $1,250 | $9,000 |
| 2021 | $632 | $10,250 | $1,250 | $9,000 |
| 2020 | $580 | $8,000 | $1,250 | $6,750 |
| 2019 | $580 | $8,000 | $1,250 | $6,750 |
| 2018 | $580 | $8,000 | $1,250 | $6,750 |
| 2017 | $329 | $8,000 | $1,250 | $6,750 |
| 2016 | $352 | $8,050 | $0 | $0 |
| 2014 | $352 | $8,050 | $0 | $0 |
Source: Public Records
Map
Nearby Homes
- 1560 Netherwood Ave
- 1541 Waverly Ave
- 1579 E Mclemore Ave
- 1571 E Mclemore Ave
- 1589 E Mclemore Ave
- 1608 Netherwood Ave
- 1609 E Mclemore Ave
- 1570 E Mclemore Ave
- 1520 Netherwood Ave
- 1579 Southern Ave
- 1585 Southern Ave
- 1616 Foster Ave
- 1642 Netherwood Ave
- 1615 Southern Ave
- 1646 E Mclemore Ave
- 1592 Southern Ave
- 1577 Kendale Ave
- 1583 Kendale Ave
- 1056 Roland St
- 1148 Rozelle St
- 1577 Waverly Ave
- 1567 Waverly Ave
- 1581 Waverly Ave
- 1561 Waverly Ave
- 1585 Waverly Ave
- 1182 S Willett St
- 1572 Netherwood Ave
- 1568 Netherwood Ave
- 938 S Willett St
- 1578 Netherwood Ave
- 1566 Waverly Ave
- 1589 Waverly Ave
- 1551 Waverly Ave
- 1582 Netherwood Ave
- 1580 Waverly Ave
- 1560 Waverly Ave
- 1593 Waverly Ave
- 1588 Netherwood Ave
- 1584 Waverly Ave
- 1545 Waverly Ave