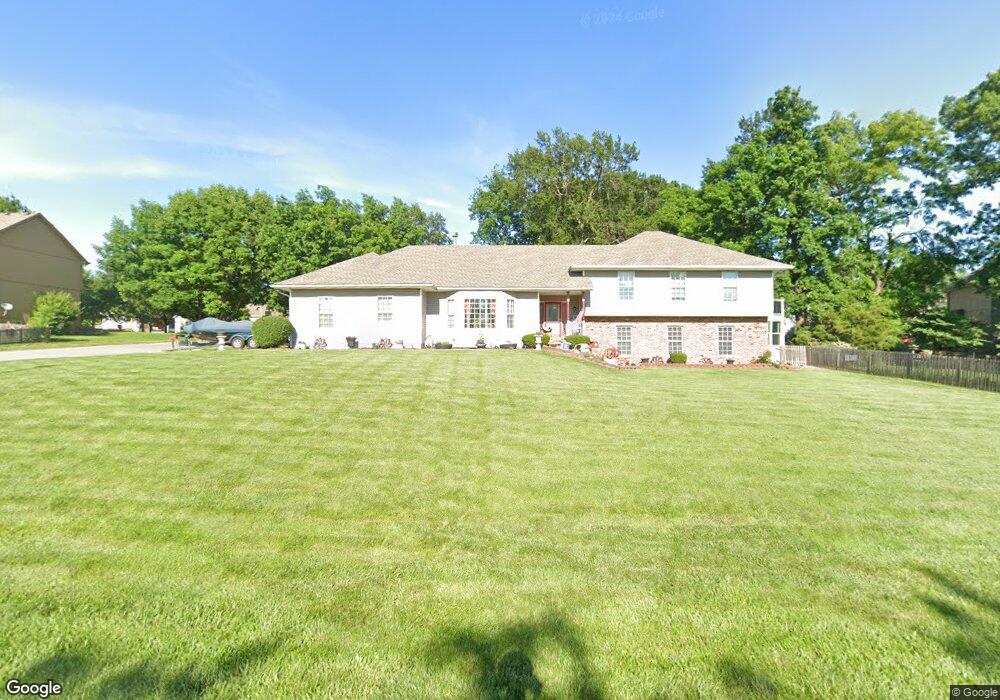
15711 E 78th St Kansas City, MO 64139
Little Blue Valley NeighborhoodEstimated Value: $399,000 - $478,000
4
Beds
4
Baths
2,122
Sq Ft
$204/Sq Ft
Est. Value
About This Home
This home is located at 15711 E 78th St, Kansas City, MO 64139 and is currently estimated at $433,176, approximately $204 per square foot. 15711 E 78th St is a home located in Jackson County with nearby schools including Bernard C. Campbell Middle School, Hazel Grove Elementary School, and Lee's Summit North High School.
Ownership History
Date
Name
Owned For
Owner Type
Purchase Details
Closed on
Feb 26, 2007
Sold by
Bond James and Bond Bernadette
Bought by
Russell Marvin B and Lewis Russell Jonesther M
Current Estimated Value
Home Financials for this Owner
Home Financials are based on the most recent Mortgage that was taken out on this home.
Original Mortgage
$230,860
Outstanding Balance
$138,659
Interest Rate
6.21%
Mortgage Type
Purchase Money Mortgage
Estimated Equity
$294,517
Purchase Details
Closed on
Dec 3, 2003
Sold by
Ramsey Dorothy
Bought by
Bond James and Rosborough Bernadette
Home Financials for this Owner
Home Financials are based on the most recent Mortgage that was taken out on this home.
Original Mortgage
$210,900
Interest Rate
7.87%
Mortgage Type
Purchase Money Mortgage
Purchase Details
Closed on
Jun 30, 1998
Sold by
Strother Investment Properties
Bought by
Ramsey Dorothy E
Home Financials for this Owner
Home Financials are based on the most recent Mortgage that was taken out on this home.
Original Mortgage
$152,000
Interest Rate
7.08%
Mortgage Type
Construction
Create a Home Valuation Report for This Property
The Home Valuation Report is an in-depth analysis detailing your home's value as well as a comparison with similar homes in the area
Home Values in the Area
Average Home Value in this Area
Purchase History
| Date | Buyer | Sale Price | Title Company |
|---|---|---|---|
| Russell Marvin B | -- | Stewart Title Of Kansas City | |
| Bond James | -- | Stewart Title | |
| Ramsey Dorothy E | -- | -- |
Source: Public Records
Mortgage History
| Date | Status | Borrower | Loan Amount |
|---|---|---|---|
| Open | Russell Marvin B | $230,860 | |
| Previous Owner | Bond James | $210,900 | |
| Previous Owner | Ramsey Dorothy E | $152,000 |
Source: Public Records
Tax History Compared to Growth
Tax History
| Year | Tax Paid | Tax Assessment Tax Assessment Total Assessment is a certain percentage of the fair market value that is determined by local assessors to be the total taxable value of land and additions on the property. | Land | Improvement |
|---|---|---|---|---|
| 2025 | $4,962 | $76,475 | $10,387 | $66,088 |
| 2024 | $4,910 | $66,500 | $12,365 | $54,135 |
| 2023 | $4,910 | $66,500 | $12,365 | $54,135 |
| 2022 | $4,931 | $59,090 | $6,080 | $53,010 |
| 2021 | $5,033 | $59,090 | $6,080 | $53,010 |
| 2020 | $4,848 | $56,259 | $6,080 | $50,179 |
| 2019 | $4,667 | $56,259 | $6,080 | $50,179 |
| 2018 | $926,622 | $53,651 | $8,369 | $45,282 |
| 2017 | $4,725 | $53,651 | $8,369 | $45,282 |
| 2016 | $4,635 | $52,307 | $6,213 | $46,094 |
| 2014 | $4,206 | $46,638 | $6,284 | $40,354 |
Source: Public Records
Map
Nearby Homes
- 7708 Brook Lane Ave
- 7709 Brook Ln
- 16104 E 76th St
- 3508 NW Winding Woods Dr
- 3802 NW Lake Dr
- 3845 NW Cimarron St
- 3608 NW Blue Jacket Dr
- 202 NW Redwood Ct
- 201 NW Redwood Ct
- 312 NW Locust St
- 221 NW Aspen Ct
- 8700 Trail Ridge St
- 215 NW Aspen St
- 8400 Fish Rd
- 3905 NE Beechwood Dr
- 203 NE Shoreview Dr
- 4535 NW Bramble Trail
- 3743 NE Woodland Ct
- 201 NW Hackberry St
- 4005 NE Channel Dr
- 12600 Brook Ct
- 7800 Brook Ct
- 7812 Highridge Ct
- 15717 E 78th St
- 7816 Highridge Ct
- 7709 Brook Ct
- 15725 E 78th St
- 7708 Brook Ct
- 7808 Highridge Ct
- 7704 Brook Ct
- 15801 E 78th St
- 7815 Highridge Ct
- 7804 Highridge Ct
- 7732 Brook Lane Ave
- 7705 Brook Ct
- 7801 Brook Ct
- 7700 Brook Ct
- 7811 Highridge Ct
- 7728 Brook Lane Ave
- 7809 Highridge Ct