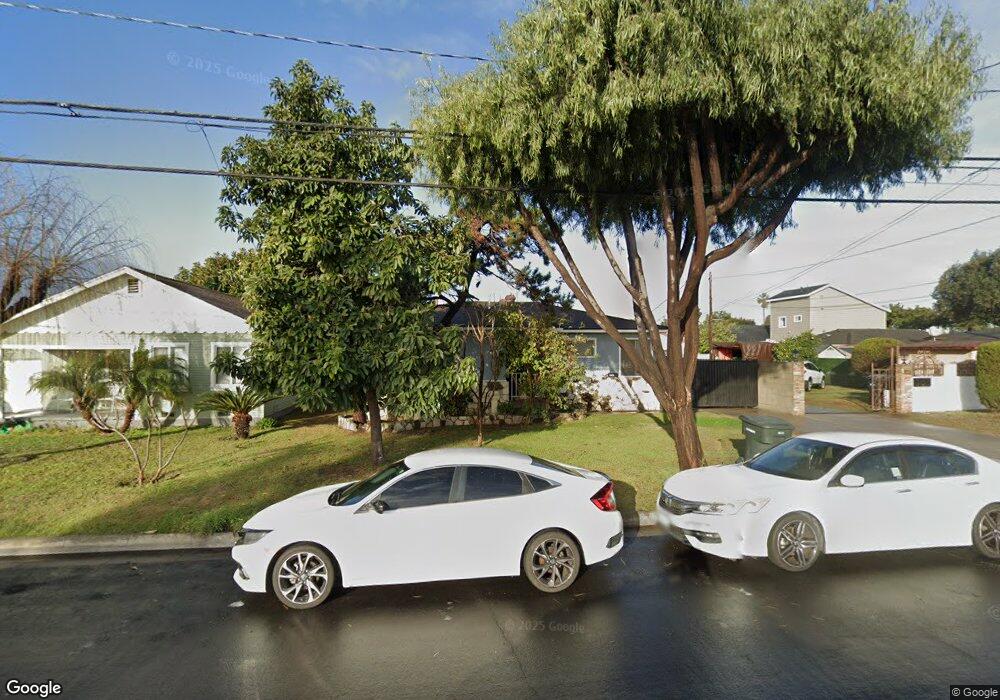
15715 Stevens Ave Bellflower, CA 90706
Estimated Value: $934,000 - $1,155,000
5
Beds
2
Baths
2,266
Sq Ft
$452/Sq Ft
Est. Value
About This Home
This home is located at 15715 Stevens Ave, Bellflower, CA 90706 and is currently estimated at $1,023,947, approximately $451 per square foot. 15715 Stevens Ave is a home located in Los Angeles County with nearby schools including Washington Elementary School, Bellflower High School, and Southland Christian Academy.
Ownership History
Date
Name
Owned For
Owner Type
Purchase Details
Closed on
Feb 8, 2002
Sold by
Duran Jose A and Duran Rosa A
Bought by
Duran Jose A and Duran Rosa A
Current Estimated Value
Home Financials for this Owner
Home Financials are based on the most recent Mortgage that was taken out on this home.
Original Mortgage
$238,000
Outstanding Balance
$96,251
Interest Rate
6.75%
Mortgage Type
Purchase Money Mortgage
Estimated Equity
$927,696
Purchase Details
Closed on
Sep 26, 1995
Sold by
Flores Stendahl Carmina
Bought by
Stendahl John A
Home Financials for this Owner
Home Financials are based on the most recent Mortgage that was taken out on this home.
Original Mortgage
$199,234
Interest Rate
7.59%
Mortgage Type
FHA
Purchase Details
Closed on
Sep 25, 1995
Sold by
Hall Andrew C and Hall Naomi M
Bought by
Duran Jose A and Duran Rosa A
Home Financials for this Owner
Home Financials are based on the most recent Mortgage that was taken out on this home.
Original Mortgage
$199,234
Interest Rate
7.59%
Mortgage Type
FHA
Create a Home Valuation Report for This Property
The Home Valuation Report is an in-depth analysis detailing your home's value as well as a comparison with similar homes in the area
Home Values in the Area
Average Home Value in this Area
Purchase History
| Date | Buyer | Sale Price | Title Company |
|---|---|---|---|
| Duran Jose A | -- | Southland Title | |
| Duran Jose A | -- | Southland Title | |
| Stendahl John A | -- | Investors Title Company | |
| Duran Jose A | $210,000 | Investors Title Company |
Source: Public Records
Mortgage History
| Date | Status | Borrower | Loan Amount |
|---|---|---|---|
| Open | Duran Jose A | $238,000 | |
| Closed | Duran Jose A | $238,000 | |
| Closed | Duran Jose A | $199,234 |
Source: Public Records
Tax History Compared to Growth
Tax History
| Year | Tax Paid | Tax Assessment Tax Assessment Total Assessment is a certain percentage of the fair market value that is determined by local assessors to be the total taxable value of land and additions on the property. | Land | Improvement |
|---|---|---|---|---|
| 2025 | $5,469 | $370,404 | $170,925 | $199,479 |
| 2024 | $5,469 | $363,142 | $167,574 | $195,568 |
| 2023 | $4,963 | $356,023 | $164,289 | $191,734 |
| 2022 | $4,667 | $349,043 | $161,068 | $187,975 |
| 2021 | $4,567 | $342,200 | $157,910 | $184,290 |
| 2020 | $4,528 | $338,692 | $156,291 | $182,401 |
| 2019 | $4,454 | $332,052 | $153,227 | $178,825 |
| 2018 | $4,198 | $325,542 | $150,223 | $175,319 |
| 2016 | $4,016 | $312,903 | $144,391 | $168,512 |
| 2015 | $3,935 | $308,204 | $142,223 | $165,981 |
| 2014 | $3,893 | $302,168 | $139,438 | $162,730 |
Source: Public Records
Map
Nearby Homes
- 9548 Alondra Blvd
- 15751 Blaine Ave
- 9527 Los Angeles St
- 15509 Blaine Ave
- 9334 Alondra Blvd
- 9321 Harvard St
- 9206 Rendalia St
- 9529 Oak St
- 9863 Alondra Blvd
- 9716 Oak St
- 15355 Eucalyptus Ave
- 15129 Cabell Ave
- 9719 Belmont St
- 9545 Heiner St
- 9045 Algeroma St
- 14716 Leahy Ave
- 9231 Laurel St
- 15804 Lakewood Blvd
- 16712 Bellflower Blvd
- 10013 Flora Vista St
- 15711 Stevens Ave
- 15721 Stevens Ave
- 9527 Rendalia St
- 9532 Linden St
- 9523 Rendalia St
- 9516 Linden St
- 9520 Linden St
- 15731 Stevens Ave
- 9519 Rendalia St
- 9512 Linden St
- 9513 Rendalia St
- 9508 Linden St
- 15706 Stevens Ave
- 15716 Stevens Ave
- 9531 Linden St
- 9507 Rendalia St
- 15724 Stevens Ave
- 9537 Linden St
- 15700 Stevens Ave
- 15636 Stevens Ave