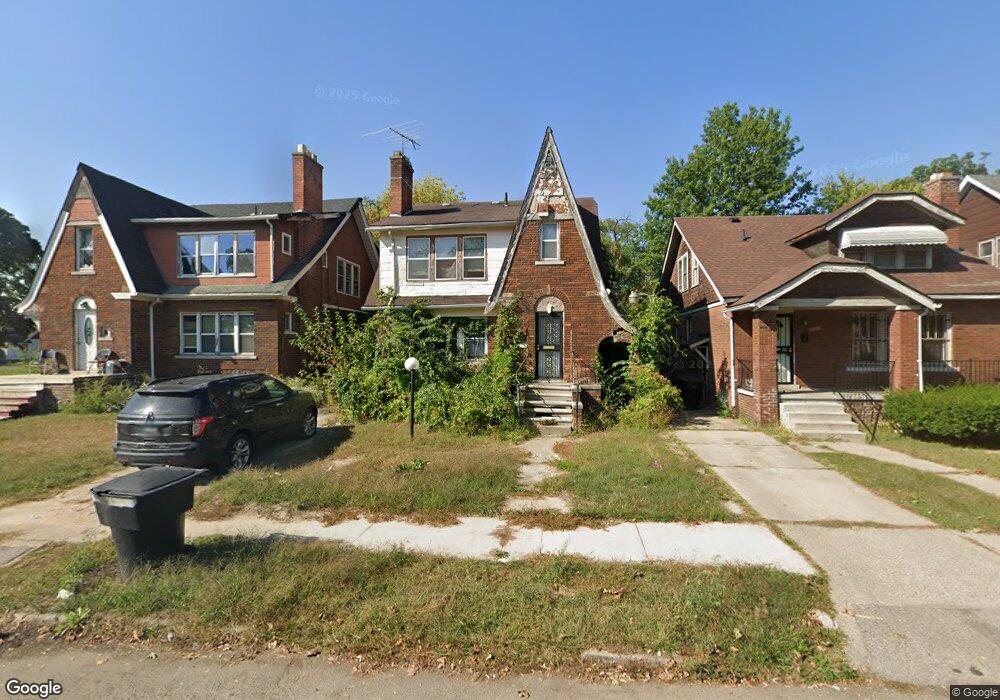
15717 Turner St Detroit, MI 48238
Fitzgerald NeighborhoodEstimated Value: $119,000 - $142,000
--
Bed
2
Baths
1,954
Sq Ft
$66/Sq Ft
Est. Value
About This Home
This home is located at 15717 Turner St, Detroit, MI 48238 and is currently estimated at $129,913, approximately $66 per square foot. 15717 Turner St is a home located in Wayne County with nearby schools including Mary McLeod Bethune Elementary/Middle School, Charles L. Spain Elementary-Middle School, and Edward 'Duke' Ellington Conservatory of Music and Art.
Ownership History
Date
Name
Owned For
Owner Type
Purchase Details
Closed on
Mar 5, 2024
Sold by
Robertson Candis and Askew Jarvis
Bought by
Askew Jarvis
Current Estimated Value
Purchase Details
Closed on
Apr 4, 2017
Sold by
United Community Housing Coalition
Bought by
Robertson Candis
Purchase Details
Closed on
Dec 16, 2016
Sold by
The Tricycle Collecitive
Bought by
United Community Housing Coalition
Purchase Details
Closed on
Dec 2, 2015
Sold by
Splendid Property Llc
Bought by
Red City Llp
Purchase Details
Closed on
Dec 30, 2013
Sold by
Peh Ee Meng
Bought by
Splendid Property Llc
Purchase Details
Closed on
Nov 7, 2013
Sold by
Wayne County Treasurer
Bought by
Peh Ee Meng
Purchase Details
Closed on
Oct 26, 2007
Sold by
Martin Alexander
Bought by
Martin Carolyn Ann
Create a Home Valuation Report for This Property
The Home Valuation Report is an in-depth analysis detailing your home's value as well as a comparison with similar homes in the area
Home Values in the Area
Average Home Value in this Area
Purchase History
| Date | Buyer | Sale Price | Title Company |
|---|---|---|---|
| Askew Jarvis | -- | None Listed On Document | |
| Askew Jarvis | -- | None Listed On Document | |
| Robertson Candis | -- | None Available | |
| United Community Housing Coalition | -- | None Available | |
| Red City Llp | -- | None Available | |
| Splendid Property Llc | -- | None Available | |
| Peh Ee Meng | $1,100 | None Available | |
| Martin Carolyn Ann | -- | None Available |
Source: Public Records
Tax History Compared to Growth
Tax History
| Year | Tax Paid | Tax Assessment Tax Assessment Total Assessment is a certain percentage of the fair market value that is determined by local assessors to be the total taxable value of land and additions on the property. | Land | Improvement |
|---|---|---|---|---|
| 2025 | $1,108 | $50,100 | $0 | $0 |
| 2024 | $1,108 | $44,100 | $0 | $0 |
| 2023 | $1,321 | $35,900 | $0 | $0 |
| 2022 | $1,417 | $27,800 | $0 | $0 |
| 2021 | $220 | $0 | $0 | $0 |
| 2020 | $1,437 | $20,600 | $0 | $0 |
| 2019 | $1,356 | $15,300 | $0 | $0 |
| 2018 | $1,189 | $12,500 | $0 | $0 |
| 2017 | $201 | $10,600 | $0 | $0 |
| 2016 | $1,082 | $29,600 | $0 | $0 |
| 2015 | $831 | $13,900 | $0 | $0 |
| 2013 | $1,785 | $19,493 | $0 | $0 |
| 2010 | -- | $27,929 | $744 | $27,185 |
Source: Public Records
Map
Nearby Homes
- 15709 Turner St
- 15844 Turner St
- 15480 Woodingham Dr
- 15861 Tuller St
- 15493 San Juan Dr
- 15909 Woodingham Dr
- 15930 Turner St
- 7403 Midland St
- 16017 San Juan Dr
- 15363 Turner St
- 15810 Prairie St
- 15457 Cloverlawn St
- 15931 Prairie St
- 15478 Northlawn St
- 15859 Cloverlawn St
- 15703 Northlawn St
- 15895 Cloverlawn St
- 16164 Turner St
- 16139 Greenlawn St
- 15349 San Juan Dr
- 15716 Woodingham Dr
- 15710 Woodingham Dr
- 15724 Woodingham Dr
- 15725 Turner St
- 15702 Woodingham Dr
- 15701 Turner St
- 15730 Woodingham Dr
- 15731 Turner St
- 15738 Woodingham Dr
- 15737 Turner St
- 15746 Woodingham Dr
- 15743 Turner St
- 15517 Turner St
- 15754 Woodingham Dr
- 15755 Turner St
- 15511 Turner St
- 15510 Woodingham Dr
- 15717 Woodingham Dr
- 15709 Woodingham Dr
- 15761 Turner St