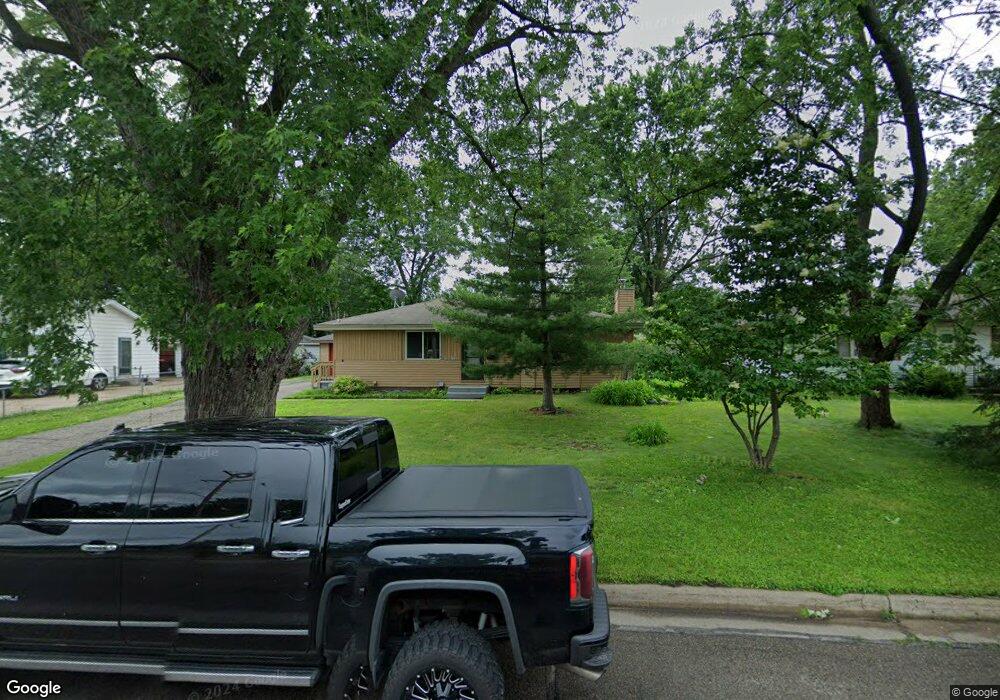
1572 Pullman Ave Saint Paul Park, MN 55071
Estimated Value: $301,000 - $327,000
3
Beds
2
Baths
1,040
Sq Ft
$301/Sq Ft
Est. Value
About This Home
This home is located at 1572 Pullman Ave, Saint Paul Park, MN 55071 and is currently estimated at $313,453, approximately $301 per square foot. 1572 Pullman Ave is a home located in Washington County with nearby schools including Pullman Elementary School, Oltman Middle School, and Park Senior High School.
Ownership History
Date
Name
Owned For
Owner Type
Purchase Details
Closed on
May 10, 2019
Sold by
Hpa Us1 Llc
Bought by
Hpa Jv Borrower 2019 1 Ath Llc
Current Estimated Value
Purchase Details
Closed on
Apr 1, 2019
Sold by
Hp Minnesota I Llc
Bought by
Hpa Us1 Llc
Purchase Details
Closed on
Oct 3, 2018
Sold by
1572 Pullman Properties Llc
Bought by
Hp Minnesota I Llc
Purchase Details
Closed on
Apr 4, 2018
Sold by
Weber Scott M
Bought by
1572 Sullman Properties Llc
Home Financials for this Owner
Home Financials are based on the most recent Mortgage that was taken out on this home.
Original Mortgage
$123,750
Interest Rate
4.43%
Mortgage Type
Commercial
Purchase Details
Closed on
May 28, 1998
Sold by
Miller Kurt M and Miller Danielle K
Bought by
Weber Scott M and Weber Lynn M
Create a Home Valuation Report for This Property
The Home Valuation Report is an in-depth analysis detailing your home's value as well as a comparison with similar homes in the area
Home Values in the Area
Average Home Value in this Area
Purchase History
| Date | Buyer | Sale Price | Title Company |
|---|---|---|---|
| Hpa Jv Borrower 2019 1 Ath Llc | $500 | Stewart Title | |
| Hpa Us1 Llc | $500 | Stewart Title | |
| Hp Minnesota I Llc | $225,000 | Burnet Title | |
| 1572 Sullman Properties Llc | $165,000 | Watermark Title Agency | |
| Weber Scott M | -- | Watermark Title Agency | |
| Weber Scott M | $101,000 | -- |
Source: Public Records
Mortgage History
| Date | Status | Borrower | Loan Amount |
|---|---|---|---|
| Previous Owner | 1572 Sullman Properties Llc | $123,750 |
Source: Public Records
Tax History Compared to Growth
Tax History
| Year | Tax Paid | Tax Assessment Tax Assessment Total Assessment is a certain percentage of the fair market value that is determined by local assessors to be the total taxable value of land and additions on the property. | Land | Improvement |
|---|---|---|---|---|
| 2024 | $3,850 | $287,900 | $90,000 | $197,900 |
| 2023 | $3,850 | $291,400 | $101,000 | $190,400 |
| 2022 | $3,292 | $279,500 | $100,900 | $178,600 |
| 2021 | $3,208 | $232,700 | $84,000 | $148,700 |
| 2020 | $3,170 | $230,300 | $88,700 | $141,600 |
| 2019 | $2,228 | $224,300 | $81,000 | $143,300 |
| 2018 | $2,488 | $164,100 | $58,000 | $106,100 |
| 2017 | $2,184 | $166,900 | $67,000 | $99,900 |
| 2016 | $2,190 | $150,500 | $60,000 | $90,500 |
| 2015 | $1,938 | $116,900 | $45,500 | $71,400 |
| 2013 | -- | $93,300 | $35,400 | $57,900 |
Source: Public Records
Map
Nearby Homes
- 1601 14th Ave
- 1313 11th Ave
- 1200 Laurel Ave
- 6467 82nd St S
- 1200 Summit Ave
- 8392 Greene Ave S
- 1033 Portland Ave
- 1020 Gary Dr
- 10412 Goodview Ave S
- 10406 Glenbrook Ave S
- 10502 Glenbrook Ave S
- 10508 Glenbrook Ave S
- 10442 Glenbrook Ave S
- 816 Holley Ave
- 1227 5th St
- 1121 5th St
- 801 Summit Ave
- 6933 Prairie Ct S
- 8507 Hadley Ave S
- 8633 Grospoint Ave S
- 1584 Pullman Ave
- 1560 Pullman Ave
- 1573 13th Ave
- 1596 Pullman Ave
- 1548 Pullman Ave
- 1561 13th Ave
- 1585 13th Ave
- 1144 McCammon Ave
- 1549 13th Ave
- 1597 13th Ave
- 1597 1597 13th Ave
- 1145 Aurora Ave
- 1536 Pullman Ave
- 1600 Pullman Ave
- 1585 1585 13th Ave
- 1560 1560 13th Ave
- 1536 1536 Pullman Ave
- 1536 1536 Pullman-Avenue-
- 1537 13th Ave
- 1609 13th Ave