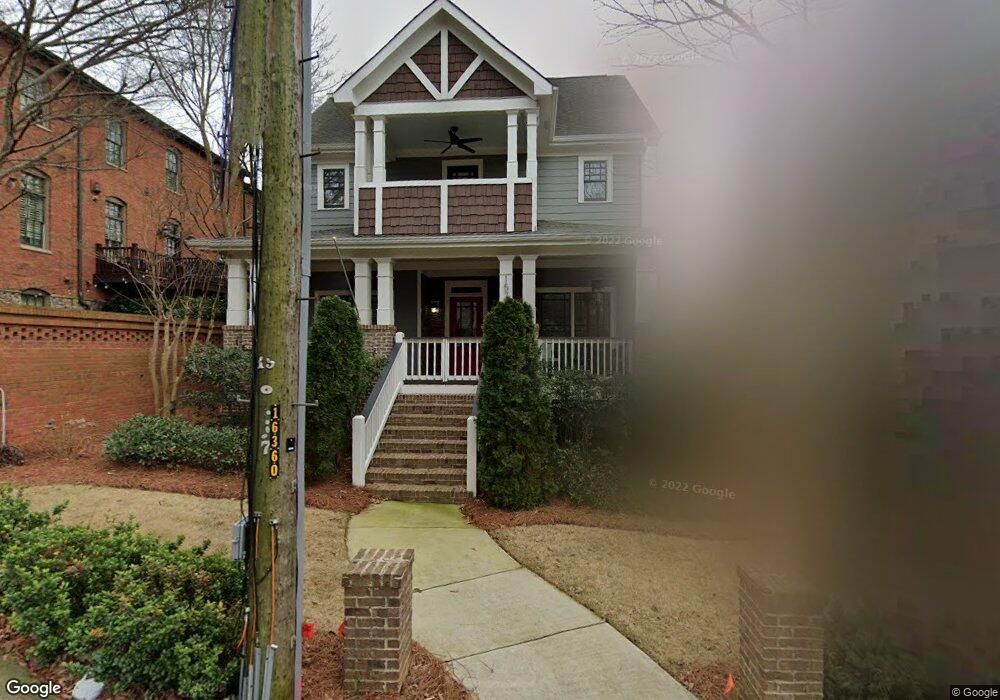
1572 Spring St SE Smyrna, GA 30080
Estimated Value: $724,000 - $798,000
4
Beds
4
Baths
2,841
Sq Ft
$265/Sq Ft
Est. Value
About This Home
This home is located at 1572 Spring St SE, Smyrna, GA 30080 and is currently estimated at $751,777, approximately $264 per square foot. 1572 Spring St SE is a home located in Cobb County with nearby schools including Smyrna Elementary School, Campbell Middle School, and Campbell High School.
Ownership History
Date
Name
Owned For
Owner Type
Purchase Details
Closed on
Mar 21, 2008
Sold by
Tri-Craft Properties Llc
Bought by
Conner Joshua G and Conner Katherine K
Current Estimated Value
Home Financials for this Owner
Home Financials are based on the most recent Mortgage that was taken out on this home.
Original Mortgage
$398,000
Outstanding Balance
$246,013
Interest Rate
5.68%
Mortgage Type
New Conventional
Estimated Equity
$505,764
Purchase Details
Closed on
Dec 6, 2007
Sold by
Tri Craft Prop Llc
Bought by
Tully Melinda L
Purchase Details
Closed on
Mar 13, 2006
Sold by
Hatcher Homes Inc
Bought by
Tri-Craft Properties Llc
Home Financials for this Owner
Home Financials are based on the most recent Mortgage that was taken out on this home.
Original Mortgage
$337,500
Interest Rate
6.19%
Create a Home Valuation Report for This Property
The Home Valuation Report is an in-depth analysis detailing your home's value as well as a comparison with similar homes in the area
Home Values in the Area
Average Home Value in this Area
Purchase History
| Date | Buyer | Sale Price | Title Company |
|---|---|---|---|
| Conner Joshua G | $420,000 | -- | |
| Tully Melinda L | -- | -- | |
| Seybt Larry W | -- | -- | |
| Wilgus Alan | -- | -- | |
| Fussell John W | -- | -- | |
| Wittan Ashley | -- | -- | |
| Crab Steven H | -- | -- | |
| Tri-Craft Properties Llc | $125,000 | -- |
Source: Public Records
Mortgage History
| Date | Status | Borrower | Loan Amount |
|---|---|---|---|
| Open | Conner Joshua G | $398,000 | |
| Previous Owner | Tri-Craft Properties Llc | $337,500 |
Source: Public Records
Tax History Compared to Growth
Tax History
| Year | Tax Paid | Tax Assessment Tax Assessment Total Assessment is a certain percentage of the fair market value that is determined by local assessors to be the total taxable value of land and additions on the property. | Land | Improvement |
|---|---|---|---|---|
| 2025 | $6,801 | $293,160 | $80,000 | $213,160 |
| 2024 | $6,905 | $298,724 | $50,000 | $248,724 |
| 2023 | $5,229 | $235,240 | $50,000 | $185,240 |
| 2022 | $5,763 | $235,240 | $50,000 | $185,240 |
| 2021 | $5,114 | $199,552 | $50,000 | $149,552 |
| 2020 | $5,114 | $199,552 | $50,000 | $149,552 |
| 2019 | $5,021 | $194,648 | $46,000 | $148,648 |
| 2018 | $4,678 | $180,132 | $40,000 | $140,132 |
| 2017 | $4,389 | $180,132 | $40,000 | $140,132 |
| 2016 | $4,390 | $180,132 | $40,000 | $140,132 |
| 2015 | $3,072 | $126,236 | $40,000 | $86,236 |
| 2014 | $3,102 | $126,236 | $0 | $0 |
Source: Public Records
Map
Nearby Homes
- 2964 Anderson Cir SE
- 2861 Bernard Ln SE
- 2781 Mathews St SE
- 1560 Mosaic Way
- 1552 Mosaic Way
- 1579 Walker St SE
- 2999 Jonquil Dr SE
- 1582 Mosaic Way Unit 1582
- 1652 Mosaic Way
- 1764 Whitfield Parc Cir
- 2791 Madison St SE
- 3064 Montclair Cir SE
- 1761 Whitfield Parc Cir SE
- 1700 Wynndowne Trail SE Unit C
- 3028 Montclair Cir SE
- 1303 Vinings Forest Ln SE
- 1568 Spring St SE
- 1578 Spring St SE
- 1580 Spring St SE
- 1580 Spring St SE Unit 1580
- 1582 Spring St SE Unit 4
- 1576 Spring St SE
- 1576 Spring St SE Unit 1576
- 1584 Spring St SE
- 1574 Spring St SE
- 1590 Spring St SE
- 1590 Spring St SE Unit 4A
- 1592 Spring St SE
- 1592 Spring St SE Unit 3
- 1588 Spring St SE Unit 3
- 1588 Spring St SE Unit 5A
- 1560 Spring St SE
- 1586 Spring St SE
- 1594 Spring St SE Unit 3
- 2980 Anderson Cir SE
- 1596 Spring St SE