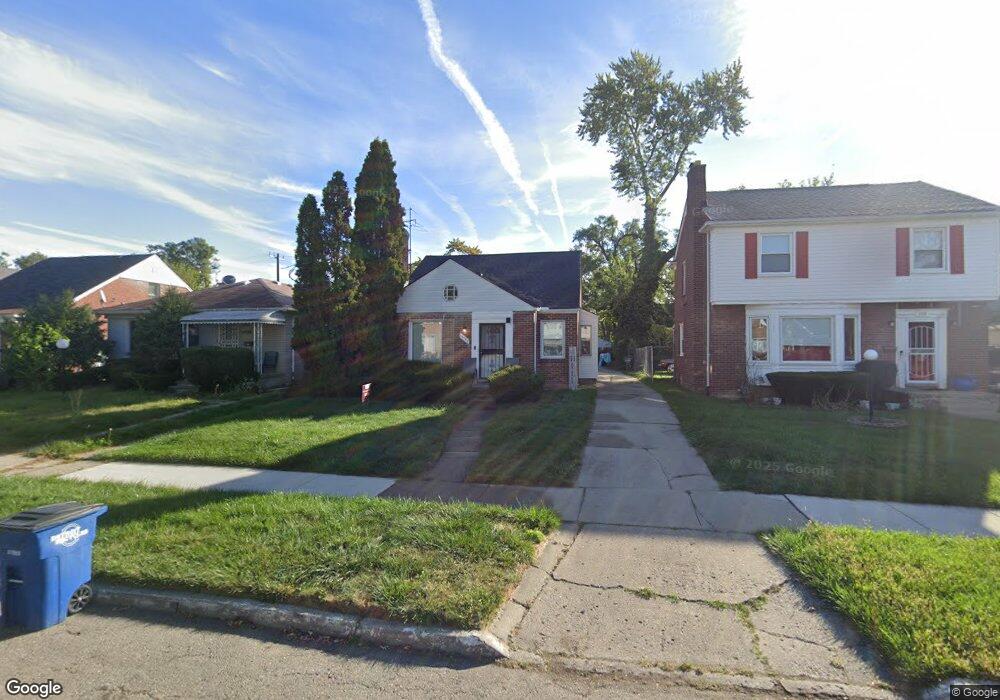
15722 Sussex St Detroit, MI 48227
Belmont NeighborhoodEstimated Value: $77,000 - $121,000
3
Beds
1
Bath
1,307
Sq Ft
$74/Sq Ft
Est. Value
About This Home
This home is located at 15722 Sussex St, Detroit, MI 48227 and is currently estimated at $96,318, approximately $73 per square foot. 15722 Sussex St is a home located in Wayne County with nearby schools including Young Coleman A. Elementary School, John R. King Academic And Performing Arts Academy, and Charles L. Spain Elementary-Middle School.
Ownership History
Date
Name
Owned For
Owner Type
Purchase Details
Closed on
Nov 13, 2019
Sold by
Greenfield Jones Lllp
Bought by
Derenzy Elizabeth and Martini Joerg
Current Estimated Value
Purchase Details
Closed on
Jul 22, 2013
Sold by
16540 Heyden Llc
Bought by
Greenfield Jones Lllp
Purchase Details
Closed on
May 3, 2013
Sold by
16540 Heyden Llc
Bought by
Greenview Jones Lllp
Purchase Details
Closed on
Nov 19, 2012
Sold by
Wayne County Treasurer
Bought by
Precise Crof Llc
Purchase Details
Closed on
Mar 17, 2011
Sold by
Morgan Kim
Bought by
Zurich Holdings Llc
Purchase Details
Closed on
Apr 16, 2009
Sold by
Secretary Of Housing & Urban Development
Bought by
Morgan Kim
Purchase Details
Closed on
Sep 17, 2008
Sold by
Mvb Mortgage Corporation
Bought by
Us Department Of Housing & Urban Develop
Purchase Details
Closed on
Aug 14, 2008
Sold by
Walker Jason and Walker Jason L
Bought by
Mvb Mortgage Corp
Create a Home Valuation Report for This Property
The Home Valuation Report is an in-depth analysis detailing your home's value as well as a comparison with similar homes in the area
Home Values in the Area
Average Home Value in this Area
Purchase History
| Date | Buyer | Sale Price | Title Company |
|---|---|---|---|
| Derenzy Elizabeth | $27,500 | Liberty Title | |
| Greenfield Jones Lllp | -- | None Available | |
| Greenfield Jones Lllp | -- | None Available | |
| Greenview Jones Lllp | $30,000 | None Available | |
| 16540 Heyden Llc | $27,000 | None Available | |
| Precise Crof Llc | $3,607 | None Available | |
| Zurich Holdings Llc | -- | None Available | |
| Morgan Kim | $9,205 | None Available | |
| Us Department Of Housing & Urban Develop | -- | None Available | |
| Mvb Mortgage Corp | $94,403 | None Available |
Source: Public Records
Tax History Compared to Growth
Tax History
| Year | Tax Paid | Tax Assessment Tax Assessment Total Assessment is a certain percentage of the fair market value that is determined by local assessors to be the total taxable value of land and additions on the property. | Land | Improvement |
|---|---|---|---|---|
| 2025 | $1,737 | $36,600 | $0 | $0 |
| 2024 | $1,737 | $31,600 | $0 | $0 |
| 2023 | $1,688 | $25,300 | $0 | $0 |
| 2022 | $1,806 | $21,000 | $0 | $0 |
| 2021 | $1,754 | $17,500 | $0 | $0 |
| 2020 | $1,753 | $17,100 | $0 | $0 |
| 2019 | $878 | $13,300 | $0 | $0 |
| 2018 | $782 | $11,600 | $0 | $0 |
| 2017 | $131 | $11,600 | $0 | $0 |
| 2016 | $849 | $19,200 | $0 | $0 |
| 2015 | $682 | $19,200 | $0 | $0 |
| 2013 | $2,398 | $23,977 | $0 | $0 |
| 2010 | -- | $34,354 | $1,023 | $33,331 |
Source: Public Records
Map
Nearby Homes
- 15746 Coyle St
- 15808 Coyle St
- 15741 Whitcomb St
- 15836 Coyle St
- 15509 Lauder St
- 15731 Lauder St
- 15707 Lauder St
- 15443 Whitcomb St
- 15499 Lauder St
- 15872 Coyle St
- 15475 Prest St
- 15366 Sussex St
- 15760 Lauder St
- 15918 Sussex St
- 15915 Sussex St
- 15355 Coyle St
- 15350 Sussex St
- 15909 Lauder St
- 15461 Marlowe St
- 15319 Sussex St
- 15716 Sussex St
- 15728 Sussex St
- 15712 Sussex St
- 15734 Sussex St
- 15735 Coyle St
- 15708 Sussex St
- 15738 Sussex St
- 15723 Coyle St
- 15739 Coyle St
- 15729 Coyle St
- 15719 Coyle St
- 15715 Coyle St
- 15704 Sussex St
- 15744 Sussex St
- 15707 Coyle St
- 15729 Sussex St
- 15717 Sussex St
- 15750 Sussex St
- 15703 Coyle St
- 15745 Coyle St