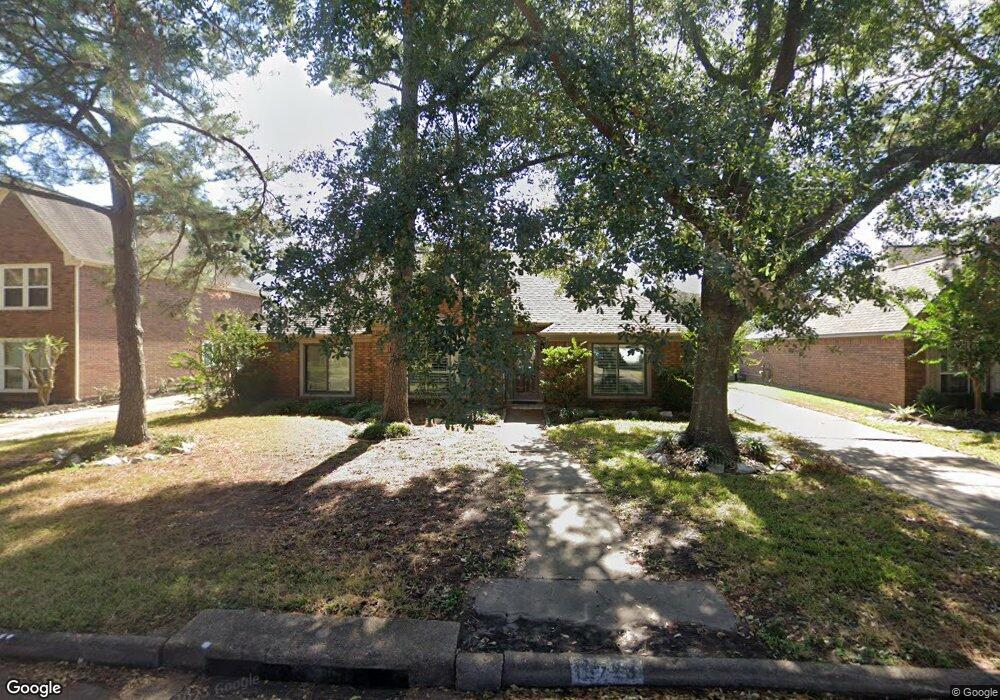
15723 Echo Lodge Dr Houston, TX 77095
Copperfield NeighborhoodEstimated Value: $345,563 - $392,000
3
Beds
3
Baths
2,758
Sq Ft
$134/Sq Ft
Est. Value
About This Home
This home is located at 15723 Echo Lodge Dr, Houston, TX 77095 and is currently estimated at $369,891, approximately $134 per square foot. 15723 Echo Lodge Dr is a home located in Harris County with nearby schools including Lowery Elementary School, Aragon Middle School, and Langham Creek High School.
Ownership History
Date
Name
Owned For
Owner Type
Purchase Details
Closed on
Sep 14, 2015
Sold by
Moreno Jacinta Castaneda
Bought by
Woodward Mary F and Moreno Reynaldo
Current Estimated Value
Purchase Details
Closed on
May 1, 2015
Sold by
Woodward John D and Woodward Mary F
Bought by
Woodward John D and Revo Mary
Purchase Details
Closed on
Aug 11, 2011
Sold by
Wheat Karen W
Bought by
Woodward John Douglas and Woodward Mary Moreno
Home Financials for this Owner
Home Financials are based on the most recent Mortgage that was taken out on this home.
Original Mortgage
$175,339
Interest Rate
4.5%
Mortgage Type
FHA
Purchase Details
Closed on
Jun 12, 2007
Sold by
Ludeke Maxine H
Bought by
Wilson Steven W
Home Financials for this Owner
Home Financials are based on the most recent Mortgage that was taken out on this home.
Original Mortgage
$165,404
Interest Rate
6.15%
Mortgage Type
Purchase Money Mortgage
Create a Home Valuation Report for This Property
The Home Valuation Report is an in-depth analysis detailing your home's value as well as a comparison with similar homes in the area
Home Values in the Area
Average Home Value in this Area
Purchase History
| Date | Buyer | Sale Price | Title Company |
|---|---|---|---|
| Woodward Mary F | -- | Attorney | |
| Woodward John D | -- | None Available | |
| Woodward John Douglas | -- | Stewart Title | |
| Wilson Steven W | -- | Startex Title Company |
Source: Public Records
Mortgage History
| Date | Status | Borrower | Loan Amount |
|---|---|---|---|
| Previous Owner | Woodward John Douglas | $175,339 | |
| Previous Owner | Wilson Steven W | $165,404 |
Source: Public Records
Tax History Compared to Growth
Tax History
| Year | Tax Paid | Tax Assessment Tax Assessment Total Assessment is a certain percentage of the fair market value that is determined by local assessors to be the total taxable value of land and additions on the property. | Land | Improvement |
|---|---|---|---|---|
| 2025 | $775 | $322,342 | $78,803 | $243,539 |
| 2024 | $775 | $325,000 | $71,442 | $253,558 |
| 2023 | $775 | $351,096 | $71,442 | $279,654 |
| 2022 | $6,091 | $328,075 | $47,628 | $280,447 |
| 2021 | $5,837 | $247,630 | $47,628 | $200,002 |
| 2020 | $5,970 | $250,005 | $36,803 | $213,202 |
| 2019 | $5,607 | $223,120 | $33,773 | $189,347 |
| 2018 | $1,430 | $205,000 | $33,773 | $171,227 |
| 2017 | $5,174 | $205,000 | $33,773 | $171,227 |
| 2016 | $5,652 | $223,959 | $33,773 | $190,186 |
| 2015 | $2,288 | $212,000 | $33,773 | $178,227 |
| 2014 | $2,288 | $217,479 | $33,773 | $183,706 |
Source: Public Records
Map
Nearby Homes
- 15726 Echo Lodge Dr
- 7318 River Garden Dr
- 15914 Waybridge Glen Ln
- 15810 Knoll Lake Dr
- 7403 Foxton Place Ct
- 7419 Foxton Place Ct
- 7411 Pacific Ridge Ct
- 7414 Starbridge Dr
- 7318 Starbridge Dr
- 7415 Broken Ridge Dr
- 7411 Marble Glen Ln
- 16023 Gladebrook Glen Ln
- 7054 River Garden Dr
- 7511 Marble Glen Ln
- 7042 River Garden Dr
- 7731 Club Lake Dr
- 16210 Summer Dew Ln
- 7311 Postwick Ct
- 16346 Pebbleglen Dr
- 16331 Dew Drop Ln
- 15719 Echo Lodge Dr
- 15727 Echo Lodge Dr
- 7414 Palisades Heights Ct
- 15715 Echo Lodge Dr
- 15731 Echo Lodge Dr
- 7410 Palisades Heights Ct
- 7411 Palisades Heights Ct
- 15722 Echo Lodge Dr
- 15718 Echo Lodge Dr
- 15711 Echo Lodge Dr
- 15735 Echo Lodge Dr
- 15714 Echo Lodge Dr
- 7410 Knoll Cliff Ct
- 15730 Echo Lodge Dr
- 7406 Palisades Heights Ct
- 7407 Palisades Heights Ct
- 7411 Harvest Dawn Ct
- 15710 Echo Lodge Dr
- 7407 Harvest Dawn Ct
- 15802 Echo Lodge Dr