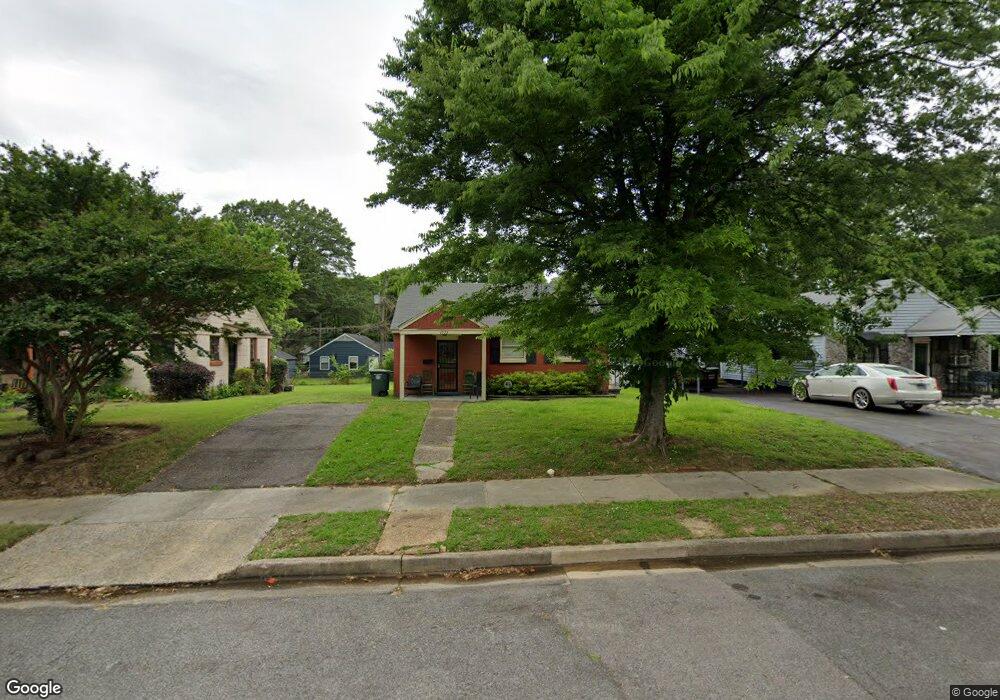
1573 E Dianne Cir Memphis, TN 38114
Southeast Memphis NeighborhoodEstimated Value: $67,000 - $95,000
2
Beds
1
Bath
725
Sq Ft
$115/Sq Ft
Est. Value
About This Home
This home is located at 1573 E Dianne Cir, Memphis, TN 38114 and is currently estimated at $83,229, approximately $114 per square foot. 1573 E Dianne Cir is a home located in Shelby County with nearby schools including Hamilton High School and Hanley School - Elementary.
Ownership History
Date
Name
Owned For
Owner Type
Purchase Details
Closed on
Feb 7, 2020
Sold by
Mid South Homebuyers Gp
Bought by
Specialized Trust Company and Fbo Daniel Brzeniski Ira
Current Estimated Value
Purchase Details
Closed on
Oct 17, 2019
Sold by
Midfirst Bank
Bought by
Mid South Homebuyers Gp
Purchase Details
Closed on
Jun 18, 2007
Sold by
Crawford Larry F
Bought by
Thompson Joseph L and Thompson Shirley F
Home Financials for this Owner
Home Financials are based on the most recent Mortgage that was taken out on this home.
Original Mortgage
$49,129
Interest Rate
6.52%
Mortgage Type
FHA
Purchase Details
Closed on
Mar 3, 2000
Sold by
Hunt Daniel L
Bought by
Crawford Larry F
Home Financials for this Owner
Home Financials are based on the most recent Mortgage that was taken out on this home.
Original Mortgage
$22,000
Interest Rate
8.29%
Create a Home Valuation Report for This Property
The Home Valuation Report is an in-depth analysis detailing your home's value as well as a comparison with similar homes in the area
Home Values in the Area
Average Home Value in this Area
Purchase History
| Date | Buyer | Sale Price | Title Company |
|---|---|---|---|
| Specialized Trust Company | $69,200 | Saddle Creek Title Llc | |
| Mid South Homebuyers Gp | $16,600 | Saddle Creek Title Llc | |
| Thompson Joseph L | $49,900 | None Available | |
| Crawford Larry F | $12,000 | -- |
Source: Public Records
Mortgage History
| Date | Status | Borrower | Loan Amount |
|---|---|---|---|
| Previous Owner | Thompson Joseph L | $49,129 | |
| Previous Owner | Crawford Larry F | $22,000 |
Source: Public Records
Tax History Compared to Growth
Tax History
| Year | Tax Paid | Tax Assessment Tax Assessment Total Assessment is a certain percentage of the fair market value that is determined by local assessors to be the total taxable value of land and additions on the property. | Land | Improvement |
|---|---|---|---|---|
| 2025 | -- | $19,875 | $1,500 | $18,375 |
| 2024 | -- | $10,150 | $1,000 | $9,150 |
| 2023 | $618 | $10,150 | $1,000 | $9,150 |
| 2022 | $618 | $10,150 | $1,000 | $9,150 |
| 2021 | $350 | $10,150 | $1,000 | $9,150 |
| 2020 | $239 | $3,300 | $1,000 | $2,300 |
| 2019 | $105 | $3,300 | $1,000 | $2,300 |
| 2018 | $105 | $3,300 | $1,000 | $2,300 |
| 2017 | $108 | $3,300 | $1,000 | $2,300 |
| 2016 | $166 | $3,800 | $0 | $0 |
| 2014 | $166 | $3,800 | $0 | $0 |
Source: Public Records
Map
Nearby Homes
- 1998 Cloverdale Dr
- 0 Dublin Ave Unit LOTS 20 & 21 LAST TW
- 2149 Wabash Ave
- 2100 Worthington Cir
- 1971 Boyle Ave
- 2151 Goff Ave
- 1816 Kerr Ave
- 1936 Frisco Ave
- 1394 Chadwick Cir
- 1891 S Parkway E
- 0 S Barksdale St
- 1481 Oaklawn St
- 1493 Oaklawn St
- 1812 Parkway Terrace
- 1804 South Pkwy E
- 1783 Parkway Terrace
- 2255 Deadrick Ave
- 1852 Glenview Ave
- 1817 S Barksdale St
- 996 Rozelle St
- 1567 E Dianne Cir
- 1575 E Dianne Cir
- 1574 W Dianne Cir
- 2003 N Dianne Cir
- 1583 E Dianne Cir
- 1578 W Dianne Cir
- 1568 W Dianne Cir
- 1995 N Dianne Cir
- 1994 S Dianne Cir
- 1572 E Dianne Cir
- 1566 E Dianne Cir
- 1576 E Dianne Cir
- 1990 S Dianne Cir
- 1564 W Dianne Cir
- 2017 N Dianne Cir
- 1582 E Dianne Cir
- 1586 E Dianne Cir
- 2021 N Dianne Cir
- 1571 W Dianne Cir
- 2008 N Dianne Cir