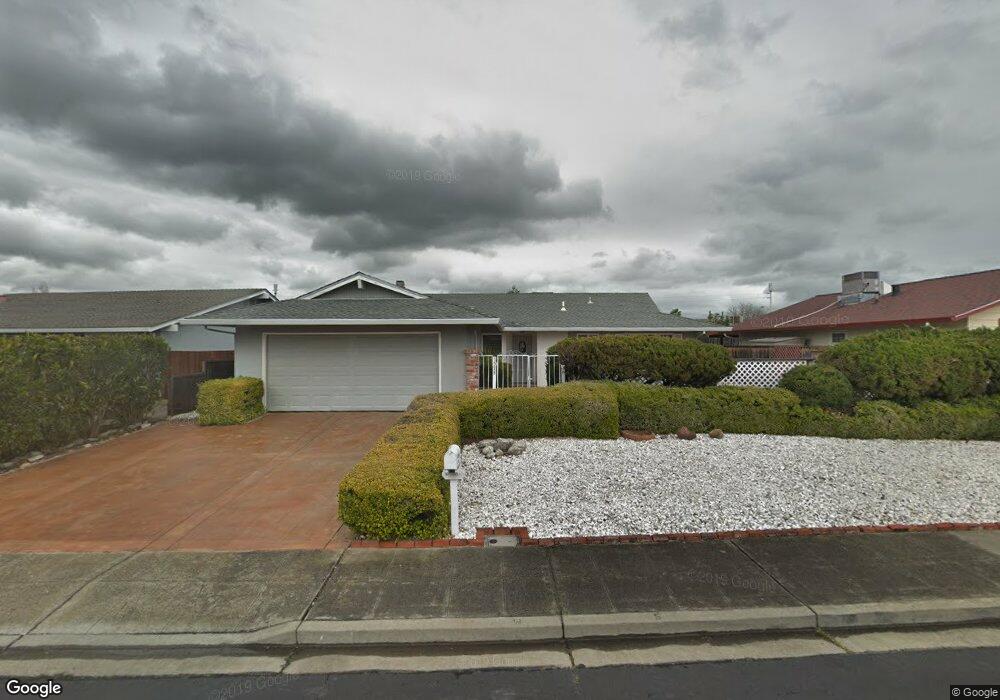
1573 Hollyhock St Livermore, CA 94551
Springtown NeighborhoodEstimated Value: $824,000 - $967,000
3
Beds
2
Baths
1,392
Sq Ft
$656/Sq Ft
Est. Value
About This Home
This home is located at 1573 Hollyhock St, Livermore, CA 94551 and is currently estimated at $913,669, approximately $656 per square foot. 1573 Hollyhock St is a home located in Alameda County with nearby schools including Altamont Creek Elementary School, Andrew N. Christensen Middle School, and Livermore High School.
Ownership History
Date
Name
Owned For
Owner Type
Purchase Details
Closed on
Mar 30, 2016
Sold by
Sakagami Hiroyuki and Sakagami Shoko
Bought by
Sakagami Hiroyuki and Sakagami Shoko
Current Estimated Value
Purchase Details
Closed on
Jun 6, 2014
Sold by
Scicluna Mary J
Bought by
Sakagami Hiroyuki and Ishida Shoko
Home Financials for this Owner
Home Financials are based on the most recent Mortgage that was taken out on this home.
Original Mortgage
$404,000
Outstanding Balance
$307,868
Interest Rate
4.25%
Mortgage Type
New Conventional
Estimated Equity
$605,801
Purchase Details
Closed on
May 22, 2002
Sold by
Scicluna Mary J and Abela Mary J
Bought by
Scicluna Mary J
Home Financials for this Owner
Home Financials are based on the most recent Mortgage that was taken out on this home.
Original Mortgage
$130,000
Interest Rate
6.89%
Purchase Details
Closed on
Oct 6, 1998
Sold by
Scicluna Robert
Bought by
Abela Mary J and Scicluna Mary J
Create a Home Valuation Report for This Property
The Home Valuation Report is an in-depth analysis detailing your home's value as well as a comparison with similar homes in the area
Home Values in the Area
Average Home Value in this Area
Purchase History
| Date | Buyer | Sale Price | Title Company |
|---|---|---|---|
| Sakagami Hiroyuki | -- | None Available | |
| Sakagami Hiroyuki | $540,000 | Old Republic Title Company | |
| Scicluna Mary J | -- | Fidelity National Title Co | |
| Abela Mary J | -- | -- |
Source: Public Records
Mortgage History
| Date | Status | Borrower | Loan Amount |
|---|---|---|---|
| Open | Sakagami Hiroyuki | $404,000 | |
| Previous Owner | Scicluna Mary J | $130,000 |
Source: Public Records
Tax History Compared to Growth
Tax History
| Year | Tax Paid | Tax Assessment Tax Assessment Total Assessment is a certain percentage of the fair market value that is determined by local assessors to be the total taxable value of land and additions on the property. | Land | Improvement |
|---|---|---|---|---|
| 2025 | $8,433 | $654,937 | $198,581 | $463,356 |
| 2024 | $8,433 | $641,960 | $194,688 | $454,272 |
| 2023 | $8,306 | $636,238 | $190,871 | $445,367 |
| 2022 | $8,184 | $616,764 | $187,129 | $436,635 |
| 2021 | $8,017 | $604,538 | $183,461 | $428,077 |
| 2020 | $7,783 | $605,268 | $181,580 | $423,688 |
| 2019 | $7,814 | $593,405 | $178,021 | $415,384 |
| 2018 | $7,647 | $581,774 | $174,532 | $407,242 |
| 2017 | $7,450 | $570,368 | $171,110 | $399,258 |
| 2016 | $7,175 | $559,185 | $167,755 | $391,430 |
| 2015 | $6,732 | $550,788 | $165,236 | $385,552 |
| 2014 | $3,473 | $247,631 | $74,289 | $173,342 |
Source: Public Records
Map
Nearby Homes
- 5179 Crocus Way
- 1688 Bluebell Dr
- 1806 Bluebell Dr
- 1241 Hibiscus Way
- 1370 Daisy Ln
- 4831 Zinnia Ct
- 1981 Monterey Dr
- 1333 Daisy Ln
- 1304 Heather Ln
- 2013 Galloway Common
- 2035 Monterey Dr
- 1479 Spring Valley Common
- 1464 Columbine Way
- 2135 Bluebell Dr
- 1031 Spring Valley Common
- 814 Sundial Cir Unit 105
- 734 Bellflower St
- 5182 Sunburst Ln
- 5473 Rainflower Dr
- 5801 Flora Common
- 1565 Hollyhock St
- 1581 Hollyhock St
- 5172 Peony Dr
- 5160 Peony Dr
- 1557 Hollyhock St
- 1613 Hollyhock St
- 5146 Peony Dr
- 5184 Peony Dr
- 1580 Hollyhock St
- 1572 Hollyhock St
- 1564 Hollyhock St
- 1588 Hollyhock St
- 5138 Peony Dr
- 1549 Hollyhock St
- 5196 Peony Dr
- 1556 Hollyhock St
- 1606 Hollyhock St
- 5130 Peony Dr
- 1541 Hollyhock St
- 1548 Hollyhock St