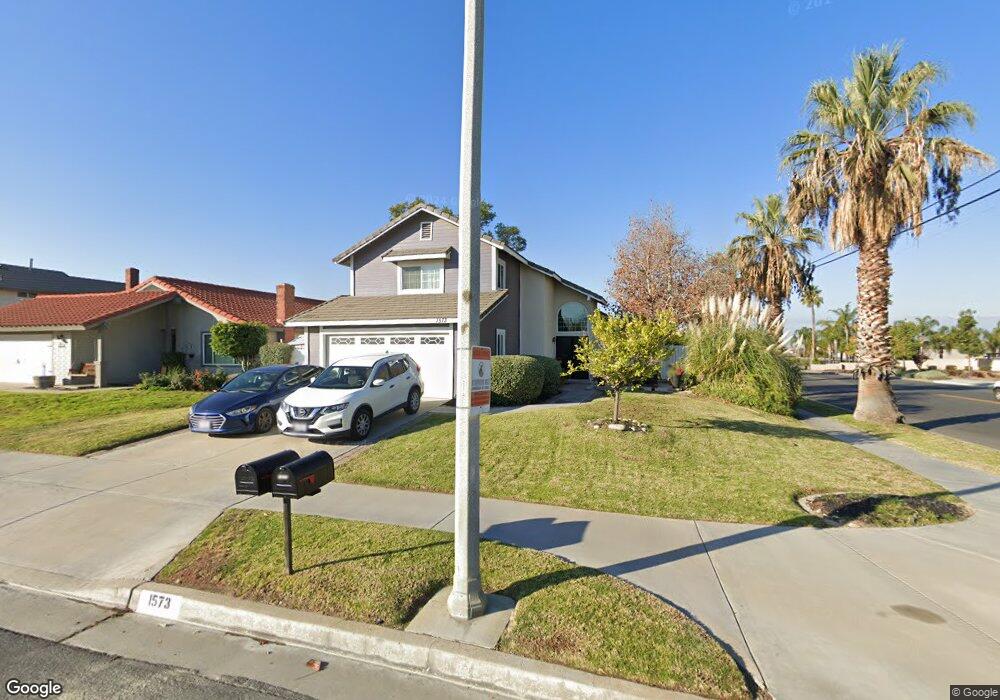
1573 Nelson St Redlands, CA 92374
North Redlands NeighborhoodEstimated Value: $587,110 - $674,000
4
Beds
3
Baths
1,858
Sq Ft
$347/Sq Ft
Est. Value
About This Home
This home is located at 1573 Nelson St, Redlands, CA 92374 and is currently estimated at $644,278, approximately $346 per square foot. 1573 Nelson St is a home located in San Bernardino County with nearby schools including Judson & Brown Elementary School, Clement Middle School, and Redlands East Valley High School.
Ownership History
Date
Name
Owned For
Owner Type
Purchase Details
Closed on
Jul 19, 2010
Sold by
Osterberg Thomas H and Osterberg Jean B
Bought by
Osterberg Thomas H and Osterberg Jean B
Current Estimated Value
Create a Home Valuation Report for This Property
The Home Valuation Report is an in-depth analysis detailing your home's value as well as a comparison with similar homes in the area
Home Values in the Area
Average Home Value in this Area
Purchase History
| Date | Buyer | Sale Price | Title Company |
|---|---|---|---|
| Osterberg Thomas H | -- | None Available |
Source: Public Records
Tax History
| Year | Tax Paid | Tax Assessment Tax Assessment Total Assessment is a certain percentage of the fair market value that is determined by local assessors to be the total taxable value of land and additions on the property. | Land | Improvement |
|---|---|---|---|---|
| 2025 | $2,839 | $226,358 | $55,733 | $170,625 |
| 2024 | $2,653 | $221,919 | $54,640 | $167,279 |
| 2023 | $2,649 | $217,568 | $53,569 | $163,999 |
| 2022 | $2,611 | $213,302 | $52,519 | $160,783 |
| 2021 | $2,659 | $209,119 | $51,489 | $157,630 |
| 2020 | $2,620 | $206,975 | $50,961 | $156,014 |
| 2019 | $2,547 | $202,917 | $49,962 | $152,955 |
| 2018 | $2,484 | $198,938 | $48,982 | $149,956 |
| 2017 | $2,463 | $195,038 | $48,022 | $147,016 |
| 2016 | $2,436 | $191,213 | $47,080 | $144,133 |
| 2015 | $2,418 | $188,341 | $46,373 | $141,968 |
| 2014 | $2,374 | $184,652 | $45,465 | $139,187 |
Source: Public Records
Map
Nearby Homes
- 1305 E San Bernardino Ave
- 1575 N Grove St
- 1678 Harrison Ln
- 1237 Sherry Way
- 1230 Cantania Dr
- 1300 E Pioneer Ave
- 1251 E Lugonia Ave Unit 24
- 1251 E Lugonia Ave Unit 18
- 1543 Hanford St
- 1423 Century St
- 0 E Lugonia Ave
- 1802 Pummelo Dr
- 1412 Medallion St
- 1653 Lucas Ln
- 1331 Century St
- 1174 Benbow Place
- 1574 Foothill Way
- 1076 Occidental Cir
- 1323 Kingswood Dr
- 1326 Campus Ave
- 1571 Nelson St
- 1574 Kelly St
- 1567 Nelson St
- 1570 Kelly St
- 1566 Kelly St
- 1572 Nelson St
- 1618 Harrison Ln
- 1615 Hamilton Ct
- 1568 Nelson St
- 1619 Harrison Ln
- 1328 Kimberly Ave
- 1628 Harrison Ln
- 1332 Kimberly Ave
- 1324 Kimberly Ave
- 1560 Nelson St
- 1625 Hamilton Ct
- 1320 Kimberly Ave
- 1629 Harrison Ln
- 1577 Kelly St
- 1561 Moriarty Ln
Your Personal Tour Guide
Ask me questions while you tour the home.