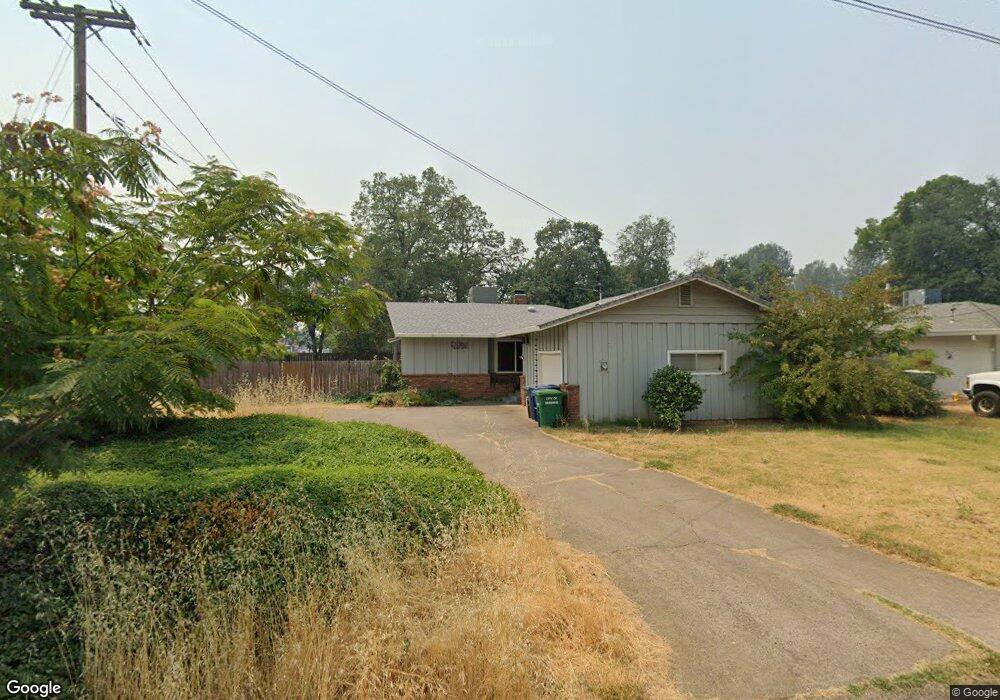
1573 Oakdale Ln Redding, CA 96002
Mistletoe NeighborhoodEstimated Value: $316,000 - $344,000
3
Beds
2
Baths
1,509
Sq Ft
$219/Sq Ft
Est. Value
About This Home
This home is located at 1573 Oakdale Ln, Redding, CA 96002 and is currently estimated at $330,249, approximately $218 per square foot. 1573 Oakdale Ln is a home located in Shasta County with nearby schools including Mistletoe Elementary School, Enterprise High School, and Montessori Children's House of Shady Oaks.
Ownership History
Date
Name
Owned For
Owner Type
Purchase Details
Closed on
Mar 12, 2021
Sold by
Gould William and Tracy Giovanni
Bought by
Gould William Boyd and Gould Giovanni Tracy
Current Estimated Value
Purchase Details
Closed on
Feb 22, 2010
Sold by
Gould William and Koher Tracy
Bought by
Gould William and Giovanni Tracy
Purchase Details
Closed on
Apr 16, 2008
Sold by
Pinnacle Equity Group Lp
Bought by
Gould William and Koher Tracy
Home Financials for this Owner
Home Financials are based on the most recent Mortgage that was taken out on this home.
Original Mortgage
$175,980
Outstanding Balance
$112,287
Interest Rate
6.11%
Mortgage Type
Purchase Money Mortgage
Estimated Equity
$217,962
Purchase Details
Closed on
Oct 3, 2007
Sold by
Murrell Kent G and Murrell Judy A
Bought by
Pinnacle Equity Group Lp
Create a Home Valuation Report for This Property
The Home Valuation Report is an in-depth analysis detailing your home's value as well as a comparison with similar homes in the area
Home Values in the Area
Average Home Value in this Area
Purchase History
| Date | Buyer | Sale Price | Title Company |
|---|---|---|---|
| Gould William Boyd | -- | None Available | |
| Gould William | -- | None Available | |
| Gould William | $220,000 | Fidelity Natl Title Co Of Ca | |
| Pinnacle Equity Group Lp | $127,000 | None Available |
Source: Public Records
Mortgage History
| Date | Status | Borrower | Loan Amount |
|---|---|---|---|
| Open | Gould William | $175,980 |
Source: Public Records
Tax History Compared to Growth
Tax History
| Year | Tax Paid | Tax Assessment Tax Assessment Total Assessment is a certain percentage of the fair market value that is determined by local assessors to be the total taxable value of land and additions on the property. | Land | Improvement |
|---|---|---|---|---|
| 2025 | $3,063 | $288,824 | $91,937 | $196,887 |
| 2024 | $3,018 | $283,162 | $90,135 | $193,027 |
| 2023 | $3,018 | $277,611 | $88,368 | $189,243 |
| 2022 | $2,932 | $272,169 | $86,636 | $185,533 |
| 2021 | $2,831 | $266,834 | $84,938 | $181,896 |
| 2020 | $2,449 | $230,000 | $45,000 | $185,000 |
| 2019 | $2,258 | $210,000 | $45,000 | $165,000 |
| 2018 | $2,110 | $195,000 | $45,000 | $150,000 |
| 2017 | $2,132 | $190,000 | $45,000 | $145,000 |
| 2016 | $1,859 | $174,000 | $40,000 | $134,000 |
| 2015 | $1,817 | $169,000 | $35,000 | $134,000 |
| 2014 | $1,795 | $165,000 | $30,000 | $135,000 |
Source: Public Records
Map
Nearby Homes
- 2164 Oxford Rd
- 1565 Becky Way
- 1511 Oakdale Ln
- 1610 Oakdale Ct
- 1703 Cascade Ln
- 1271 Mistletoe Ln
- 1535 E Cypress Ave
- 1802 Whaley Ct
- 1018 Pineland Dr
- 2796 Kenco Ave
- 1221 E Cypress Ave Unit 67
- 2820 Alfreda Way
- 1401 Casa Vereda Way
- 2915 Rockabye Ln
- 2238 Sophy Place
- 2293 Milano Trail
- 1945 Salzburg Trail
- 3340 Hartnell Ave
- Stacey Plan at Sonata
- Caroline Plan at Sonata
- 1559 Oakdale Ln
- 2122 Oxford Rd
- 2546,48,50 Oxford & 52
- 1595 Oakdale Ln
- 2148 Oxford Rd
- 2125 Oxford Rd
- 1572 Yale Ct
- 1531 Oakdale Ln
- 1601 Oakdale Ln Unit 1
- 1601 Oakdale Ln
- 1590 Oakdale Ln
- 1562 Oakdale Ln
- 2141 Oxford Rd
- 1548 Yale 1weup7mr20t3
- 1548 Yale Ct
- 1583 Yale Ct
- 1605 Oakdale Ln
- 1524 Oakdale Ln
- 1607 Oakdale Ct Unit 1
- 1607 Oakdale Ct