15733 Market St Channelview, TX 77530
Estimated Value: $383,000 - $727,000
4
Beds
1
Bath
2,515
Sq Ft
$193/Sq Ft
Est. Value
About This Home
This home is located at 15733 Market St, Channelview, TX 77530 and is currently estimated at $485,813, approximately $193 per square foot. 15733 Market St is a home located in Harris County with nearby schools including Channelview High School and Family Christian Academy.
Ownership History
Date
Name
Owned For
Owner Type
Purchase Details
Closed on
Oct 1, 2021
Sold by
Contreras Lucinda A
Bought by
Carcamo Trucking Inc
Current Estimated Value
Purchase Details
Closed on
Oct 30, 1998
Sold by
Zafra Mary Margaret Hill and Hill Mary Margaret
Bought by
Contreras Erasmo F and Contreras Lucinda A
Home Financials for this Owner
Home Financials are based on the most recent Mortgage that was taken out on this home.
Original Mortgage
$87,300
Interest Rate
6.57%
Create a Home Valuation Report for This Property
The Home Valuation Report is an in-depth analysis detailing your home's value as well as a comparison with similar homes in the area
Home Values in the Area
Average Home Value in this Area
Purchase History
| Date | Buyer | Sale Price | Title Company |
|---|---|---|---|
| Carcamo Trucking Inc | -- | Capital Title | |
| Contreras Erasmo F | -- | American Title Co |
Source: Public Records
Mortgage History
| Date | Status | Borrower | Loan Amount |
|---|---|---|---|
| Previous Owner | Contreras Erasmo F | $87,300 |
Source: Public Records
Tax History Compared to Growth
Tax History
| Year | Tax Paid | Tax Assessment Tax Assessment Total Assessment is a certain percentage of the fair market value that is determined by local assessors to be the total taxable value of land and additions on the property. | Land | Improvement |
|---|---|---|---|---|
| 2025 | $10,159 | $585,384 | $522,720 | $62,664 |
| 2024 | $10,159 | $498,264 | $435,600 | $62,664 |
| 2023 | $10,159 | $498,264 | $435,600 | $62,664 |
| 2022 | $9,952 | $427,592 | $348,480 | $79,112 |
| 2021 | $3,567 | $178,913 | $130,680 | $48,233 |
| 2020 | $3,437 | $165,700 | $130,680 | $35,020 |
| 2019 | $3,196 | $165,700 | $130,680 | $35,020 |
| 2018 | $1,195 | $172,141 | $130,680 | $41,461 |
| 2017 | $2,644 | $100,551 | $87,120 | $13,431 |
| 2016 | $2,644 | $100,551 | $60,984 | $39,567 |
| 2015 | $2,492 | $106,309 | $60,984 | $45,325 |
| 2014 | $2,492 | $106,309 | $60,984 | $45,325 |
Source: Public Records
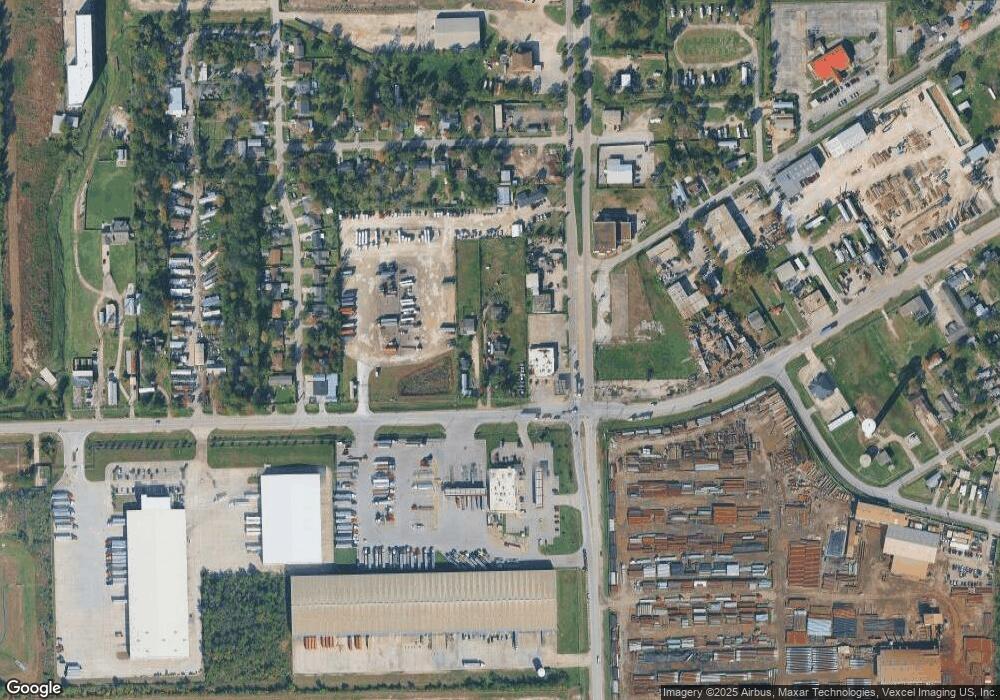
Map
Nearby Homes
- 523 Sheldon Rd
- 431 Crockett St
- 812 Coolidge St
- 16305 De Zavalla Rd
- 15603 N Brentwood St
- 702 Norell St
- 15506 Vonnett St
- 714 Horncastle St
- 818 Mccardell St
- 822 Woodhue St
- 815 Spates St
- 16516 Market St
- 908 Lakeside Dr
- 16032 1/2 Ridlon St
- 814 Kilpatrick St
- 16023 Ridlon St
- 743 Knob Hollow St
- 803 Knob Hollow St
- 16534 Market St
- 108 Cedar Ln
- 15735 Market St Unit 3
- 15735 Market St Unit 1
- 0 Sheldon Rd Unit 9892972
- 0 Sheldon Rd Unit 89918540
- 0 Sheldon Rd Unit 7926123
- 0 Sheldon Rd Unit 59737461
- 0 Sheldon Rd Unit 55633974
- 15720 Garlang St
- 15718 Garlang St
- 108 Carlang St
- 120 Carlang St
- 15716 Garlang St
- 15703 Market St
- 126 Carlang St
- 15724 Garlang St
- 132 Carlang St
- 15714 Garlang St
- 15726 Garlang St
- 202 Carlang St
- 15712 Garlang St