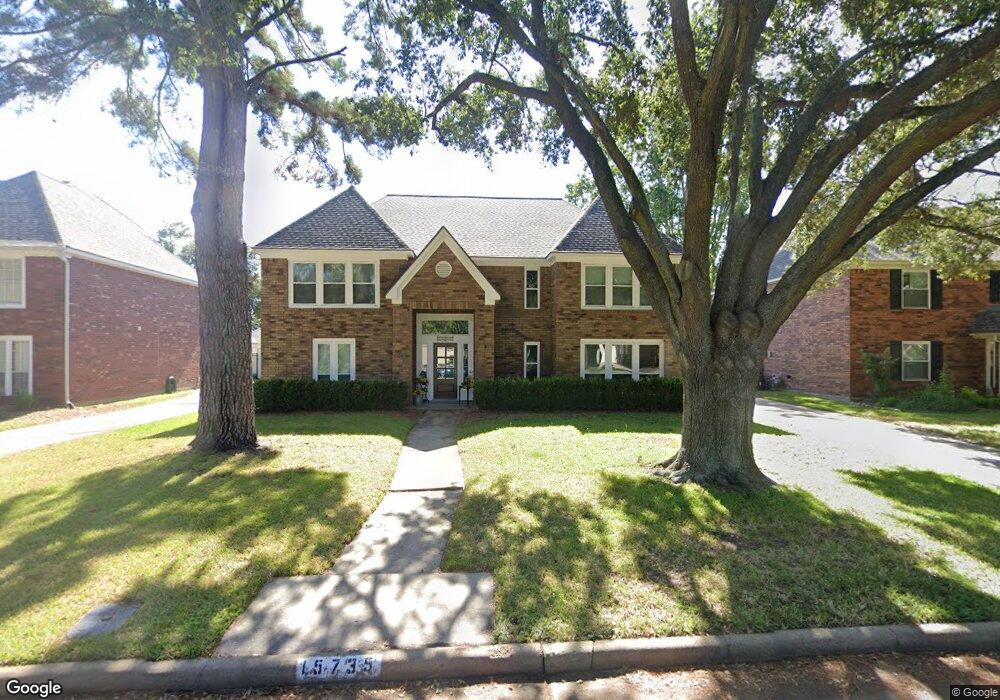
15735 Echo Lodge Dr Houston, TX 77095
Copperfield NeighborhoodEstimated Value: $422,407 - $464,000
5
Beds
4
Baths
3,714
Sq Ft
$120/Sq Ft
Est. Value
About This Home
This home is located at 15735 Echo Lodge Dr, Houston, TX 77095 and is currently estimated at $446,602, approximately $120 per square foot. 15735 Echo Lodge Dr is a home located in Harris County with nearby schools including Lowery Elementary School, Aragon Middle School, and Langham Creek High School.
Ownership History
Date
Name
Owned For
Owner Type
Purchase Details
Closed on
Apr 29, 2010
Sold by
Mathew John E and Mathew Holland K
Bought by
Alvarado Michael S
Current Estimated Value
Home Financials for this Owner
Home Financials are based on the most recent Mortgage that was taken out on this home.
Original Mortgage
$174,755
Outstanding Balance
$116,325
Interest Rate
4.91%
Mortgage Type
FHA
Estimated Equity
$330,277
Purchase Details
Closed on
Jul 7, 1994
Sold by
Vige Karen S
Bought by
Mathew John E and Mathew Holland K
Home Financials for this Owner
Home Financials are based on the most recent Mortgage that was taken out on this home.
Original Mortgage
$109,000
Interest Rate
8.47%
Purchase Details
Closed on
Mar 22, 1994
Sold by
Vige Warren John
Bought by
Vige Karen S
Purchase Details
Closed on
Jan 17, 1984
Sold by
Hughes L V and Hughes Jerry Nelson
Bought by
Mathew John Edward
Create a Home Valuation Report for This Property
The Home Valuation Report is an in-depth analysis detailing your home's value as well as a comparison with similar homes in the area
Home Values in the Area
Average Home Value in this Area
Purchase History
| Date | Buyer | Sale Price | Title Company |
|---|---|---|---|
| Alvarado Michael S | -- | Star Tex Title Company | |
| Mathew John E | -- | Sovereign Title | |
| Vige Karen S | -- | -- | |
| Mathew John Edward | -- | -- |
Source: Public Records
Mortgage History
| Date | Status | Borrower | Loan Amount |
|---|---|---|---|
| Open | Alvarado Michael S | $174,755 | |
| Previous Owner | Mathew John E | $109,000 | |
| Closed | Mathew John Edward | $0 |
Source: Public Records
Tax History Compared to Growth
Tax History
| Year | Tax Paid | Tax Assessment Tax Assessment Total Assessment is a certain percentage of the fair market value that is determined by local assessors to be the total taxable value of land and additions on the property. | Land | Improvement |
|---|---|---|---|---|
| 2025 | $5,361 | $382,183 | $81,915 | $300,268 |
| 2024 | $5,361 | $382,209 | $74,264 | $307,945 |
| 2023 | $5,361 | $407,664 | $74,264 | $333,400 |
| 2022 | $7,350 | $372,155 | $49,509 | $322,646 |
| 2021 | $7,000 | $297,000 | $49,509 | $247,491 |
| 2020 | $7,227 | $297,134 | $38,257 | $258,877 |
| 2019 | $7,267 | $289,159 | $35,107 | $254,052 |
| 2018 | $2,801 | $274,415 | $35,107 | $239,308 |
| 2017 | $6,925 | $274,415 | $35,107 | $239,308 |
| 2016 | $6,925 | $274,415 | $35,107 | $239,308 |
| 2015 | $4,624 | $266,443 | $35,107 | $231,336 |
| 2014 | $4,624 | $253,830 | $35,107 | $218,723 |
Source: Public Records
Map
Nearby Homes
- 15726 Echo Lodge Dr
- 15914 Waybridge Glen Ln
- 15810 Knoll Lake Dr
- 7419 Foxton Place Ct
- 7403 Foxton Place Ct
- 7414 Starbridge Dr
- 7318 River Garden Dr
- 7318 Starbridge Dr
- 7411 Marble Glen Ln
- 7411 Pacific Ridge Ct
- 7511 Marble Glen Ln
- 7415 Broken Ridge Dr
- 16023 Gladebrook Glen Ln
- 7054 River Garden Dr
- 7042 River Garden Dr
- 16210 Summer Dew Ln
- 7311 Postwick Ct
- 7731 Club Lake Dr
- 16346 Pebbleglen Dr
- 16331 Dew Drop Ln
- 15803 Echo Lodge Dr
- 15731 Echo Lodge Dr
- 7414 Knoll Cliff Ct
- 7410 Knoll Cliff Ct
- 15807 Echo Lodge Dr
- 15727 Echo Lodge Dr
- 15802 Echo Lodge Dr
- 7411 Palisades Heights Ct
- 15730 Echo Lodge Dr
- 7411 Knoll Cliff Ct
- 15806 Echo Lodge Dr
- 15811 Echo Lodge Dr
- 15723 Echo Lodge Dr
- 7406 Knoll Cliff Ct
- 7414 Palisades Heights Ct
- 15810 Echo Lodge Dr
- 7407 Palisades Heights Ct
- 7407 Knoll Cliff Ct
- 15722 Echo Lodge Dr
- 15815 Echo Lodge Dr